Water Quality Simple Steps For Mitigating Cybersecurity Risk Discover the simple steps that water utilities can take to easily, affordably, and sustainably improve their cybersecurity
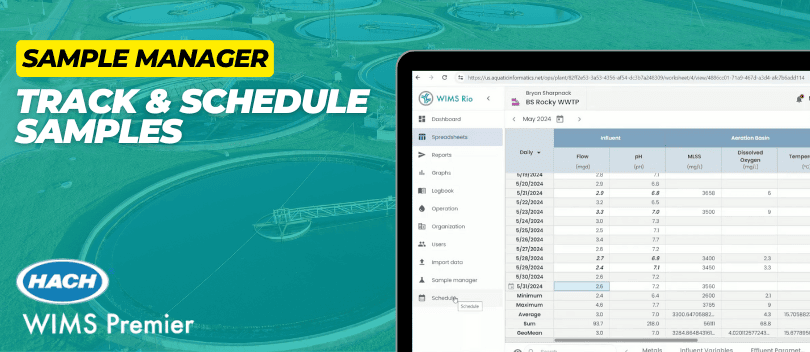
Wastewater How Utilities Can Simplify Sample Management and Reporting with Hach WIMS Platform Discover the tops benefits of implementing Rio Sample Manager, a Rio tool designed to help your team manage, schedule, and track samples with ease.
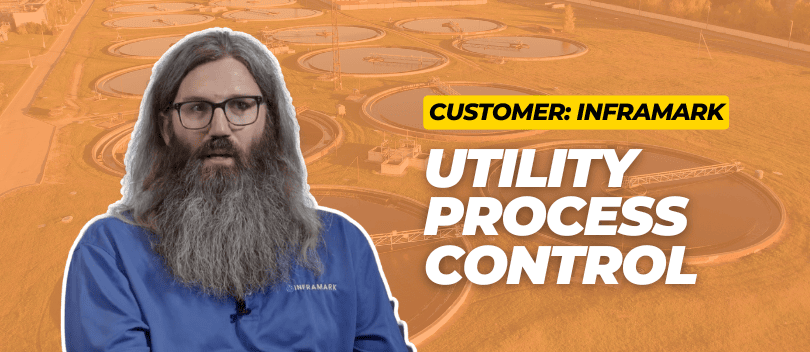
Wastewater Inframark’s Data Management Strategy: Optimizing Regional Data with Hach WIMS Discover how Hach WIMS customer Inframark leverages the software to standardize and optimize their operations.
Water Quality Hach WIMS Frequent Questions: Hach WIMS Frequently asked questions answered by Aquatic Informatics Technical Sales Engineer Tyrone Yan.
Wastewater Hach WIMS Frequent Questions: Hach WIMS Frequently asked questions answered by Aquatic Informatics Product Manager Kevin Koshko.
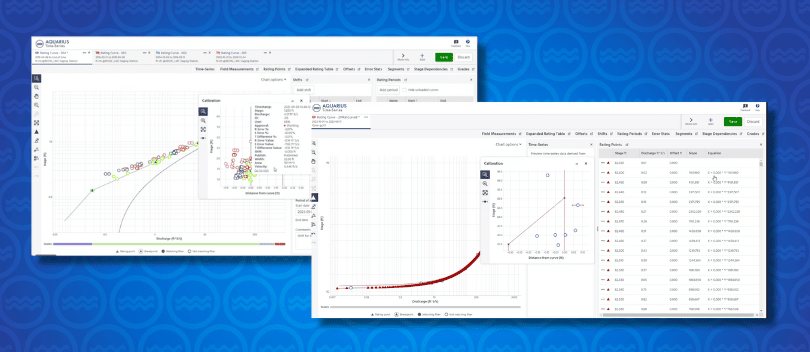
Hydrology Introducing the Rating Review Tool: Introducing the Rating Review Tool: a new step forward for raving curve reviews replacing RDT.
Water Quality WIMS Rio Frequent Questions: WIMS Rio Frequently asked questions answered by Aquatic Informatics Technical Sales Engineer Tyrone Yan.
Hydrology How to Monitor and Manage Groundwater Get the full interview between Nicole Nally and H2O Global discussing how Aquarius can help solve groundwater monitoring challenges.
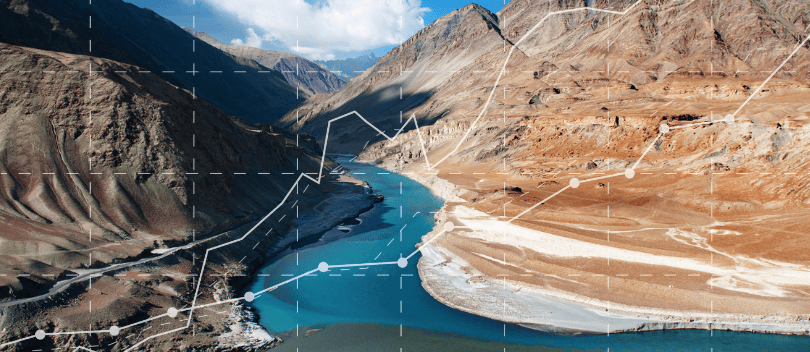
Hydrology Best Practice Approach to Stage-Discharge Rating Curve Development Discover best practices to developing stage-discharge rating curves.
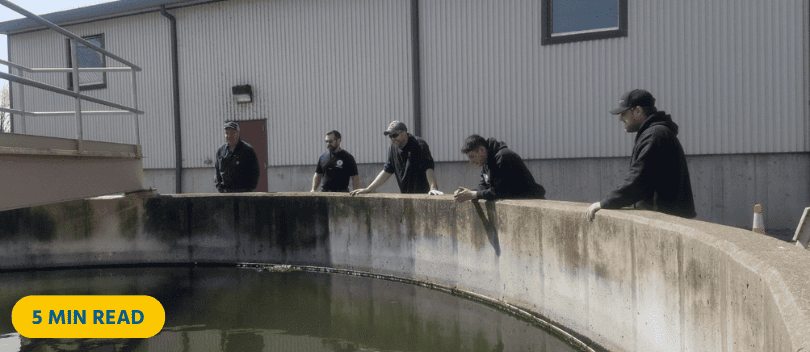
Wastewater 5 Ways Rio Software Has Improved Penn Yan Facility’s Operations Learn about the 5 Ways Rio has Improved Penn Yan Facility's Operations & Compliance.
Water Quality 7 Ways to Quality Control Environmental Data Learn about the 7 New Ways to Quality Control Environmental Data Such as Wind & Water in Real-Time