Introducing the Rating Review Tool:
A Step Forward for Rating Curve Development by Mark Edwards, Training Specialist
We are thrilled to announce a significant milestone in the evolution of Aquarius Time-Series software: the deprecation of the Rating Development Toolbox (RDT) in version 23.4, making way for the new Rating Review Tool (RRT).
This change couldn’t have come soon enough. I’m excited to share what this means for our customers, particularly those hydrologists and technicians that develop rating curves in Aquarius.
Looking Back on the Beginning
When I joined Aquatic Informatics (AQI) in 2013, a significant development was on the horizon with the release of version 3.6.
Dubbed the 'Age of Aquarius,' this update introduced blended rating curves, a feature that allowed rating periods to overlap—an essential advancement for hydrologists, especially those in the Antipodes that never use shifts. In regions like New Zealand, with its massive rivers carrying substantial bed material, the traditional Northern Hemisphere approach of using shifts for rating development was inadequate.
Past RDT Features
The dynamic nature of these rivers often led to a new curve being created with even just one measurement deviating significantly from the existing curve. Blended rating curves addressed this challenge by prorating derived discharge from one rating period into the next, gradually transitioning until the new curve took full effect.
This innovation was particularly significant for hydrologists in the Southern Hemisphere, where rating models often comprised over 200 curves. The blending feature streamlined the process, allowing for more accurate and efficient rating curve development. It's worth noting that this approach differed from the traditional method employed in North America, where shifts were predominantly used.
At the time, our Senior Hydrologist, Stu Hamilton, elucidated the distinction between "Blenders" down under and "Shifters" up over, highlighting the regional nuances in rating curve development methodologies.
RDT Over the Years
When utilizing the previous Rating Development Toolbox (RDT) with a rating model dataset containing 200+ curves, users often experienced significant latency while waiting for the application to load and become operational. Despite this delay, users typically interacted with only the most recent curve, occasionally referencing earlier curves for analysis and calibration purposes.
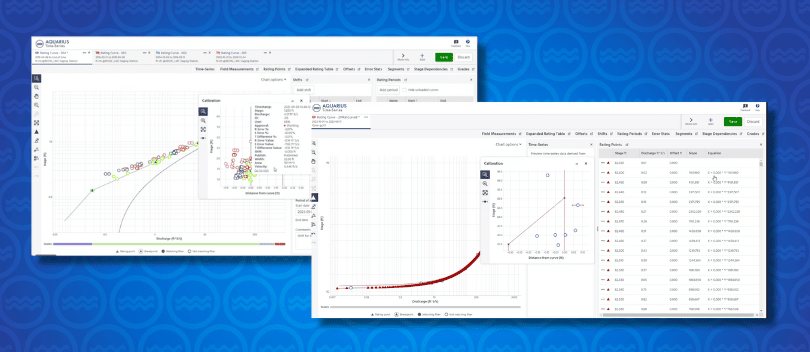
The introduction of the new Rating Review Tool (RRT) marked a substantial improvement in performance. This tool loads rapidly in a web page, focusing solely on the latest curve while still allowing users to open and overlay additional curves as needed. Unlike its predecessor, RRT operates smoothly and efficiently, providing a more streamlined user experience.
Why the Change for RDT?
The decision to retire the RDT signifies a major shift away from separate "client" installations—a concept that originated with the original Aquarius Workstation. Initially designed as a standalone installer for desktop machines, this approach predates the adoption of a "server" with a centralized Time-Series database. This evolution in software architecture reflects the industry's progression towards more integrated and efficient systems.
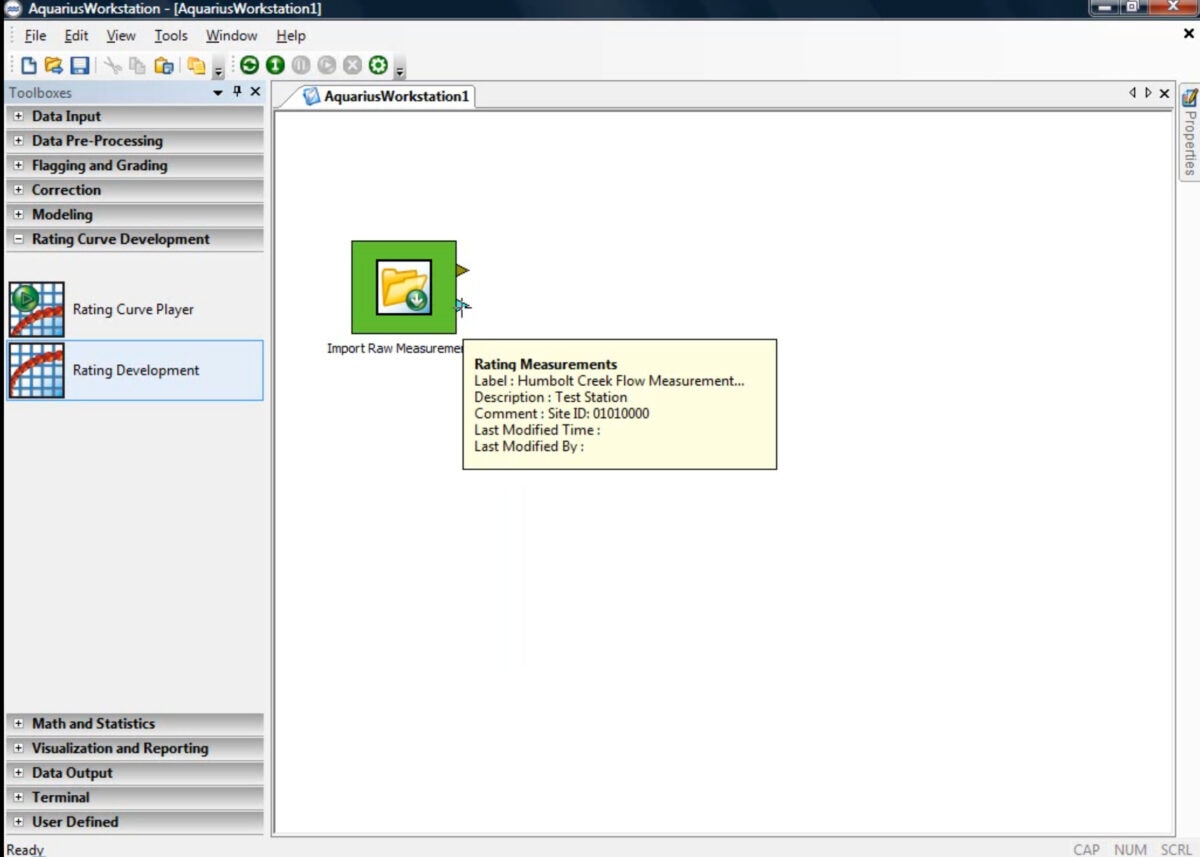
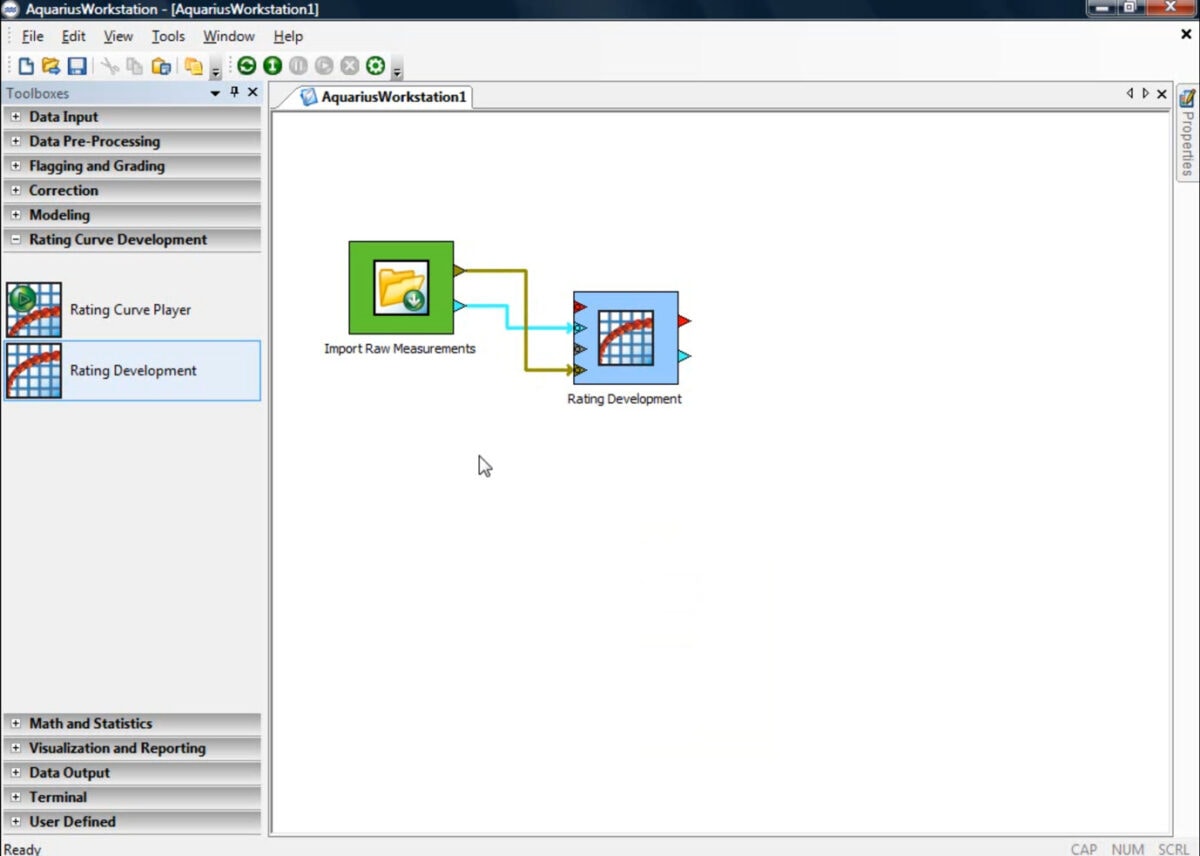
In the early stages of Aquarius development, the use of a whiteboard to drag toolboxes onto the workspace and import raw data by wiring up input data was standard practice. Additionally, the ability to hover over an output port to view metadata in a pop-up window provided users with valuable insights during the rating model development process.
The transition from the RDT to the RRT represents a major advancement in rating curve development, offering users a more efficient and user-friendly toolset all within a browser window.
Evolution of RDT
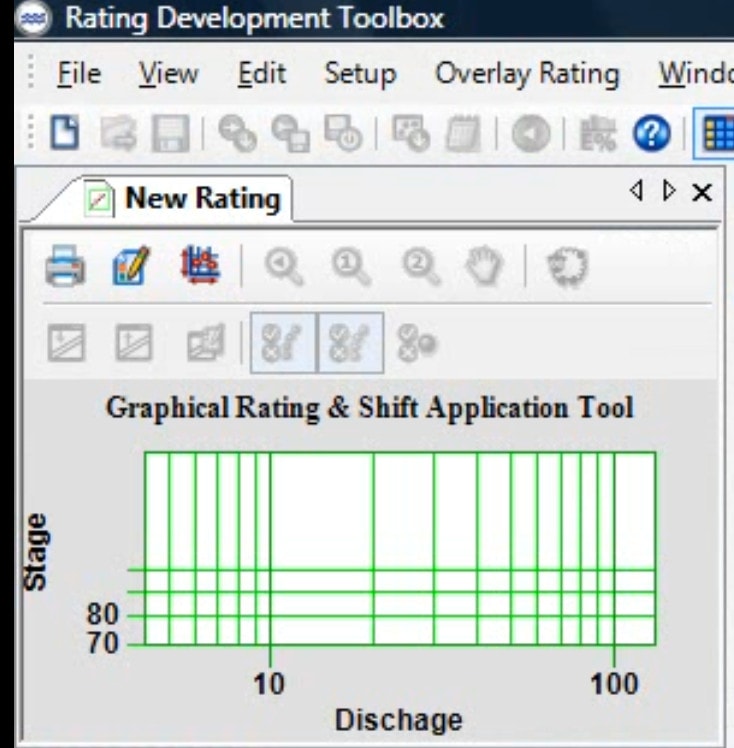
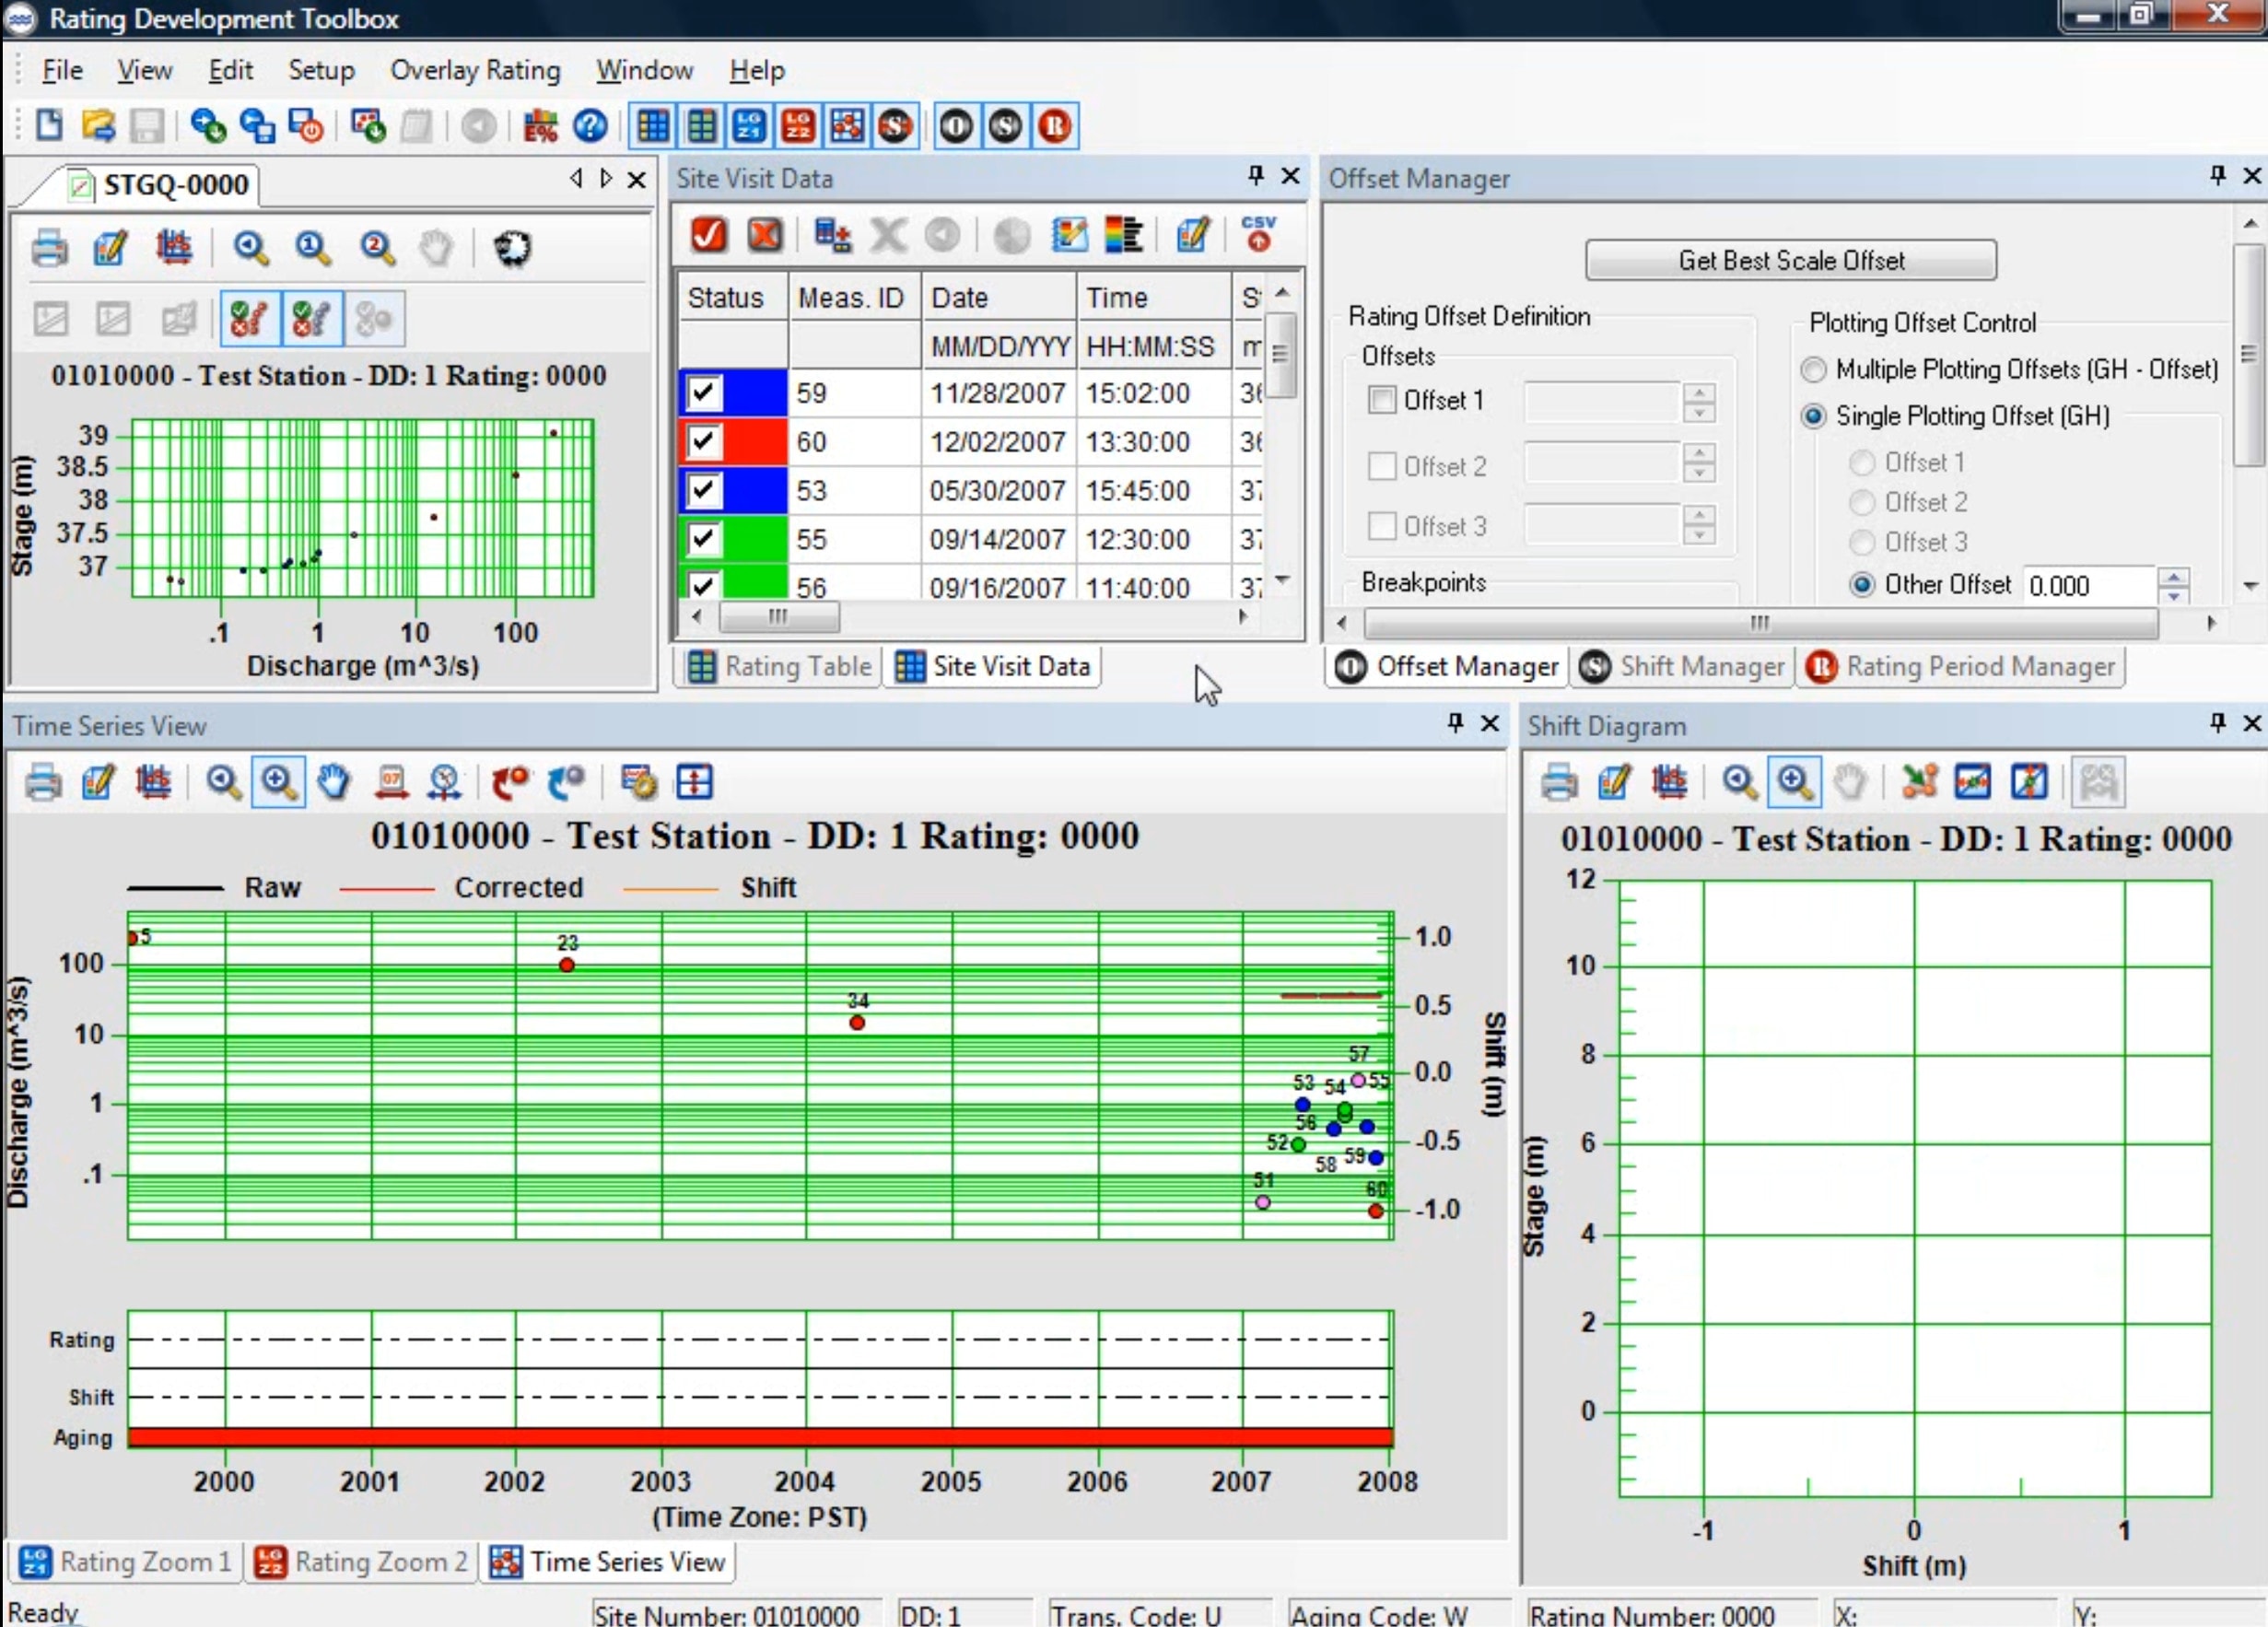
When the data finally loaded, the user interface looked like this: a busy cluster of boxes and grey windows.
It may not have looked like much, but it was very useful, and quite ground-breaking for its time. The RDT interface didn't change much over the next 15 years.
GRSAT was a graphical way to see your rating curve in both logarithmic zoom (Rating Zoom 1) and arithmetic / linear zoom (Rating Zoom 2), and then see the input Time-Series and derived output from calibrations in a model.
Take a trip down memory lane by enjoying this old video of Peter Hudson, one of the founders of Aquatic Informatics explain the original RDT in this “Intro to Rating Curve Development” .wmv video.
The Development of the Next Generation Platform
Over the years, and with the development of the Next Generation (NG) platform, all the code for Aquarius Time-Series was rewritten. One-by-one, we have been deprecating each toolbox and replacing it with .NET based tools that work in HTML. We did this because Microsoft deprecated Silverlight, upon which Springboard was built. Everyone was forced to use Internet Explorer (my least favourite browser in history).
The Data Review Tool (DRT) replaced Quick View and Data Correction. The Data Import Tool (DIT) replaced Append Logger, and now the Rating Review Tool (RRT) is replacing the last of them: Rating Development. All the new tools work awesome in Chrome and Firefox browsers.
There has been a panel of experts from all over the world, including the United States Geological Survey (USGS), Water Survey of Canada (WSC), National Institute of Water and Atmospheric Research (NIWA) and many other members of other Aquatic Community that have been working with our Product Management and Engineering teams to give the green light for deprecating RDT.
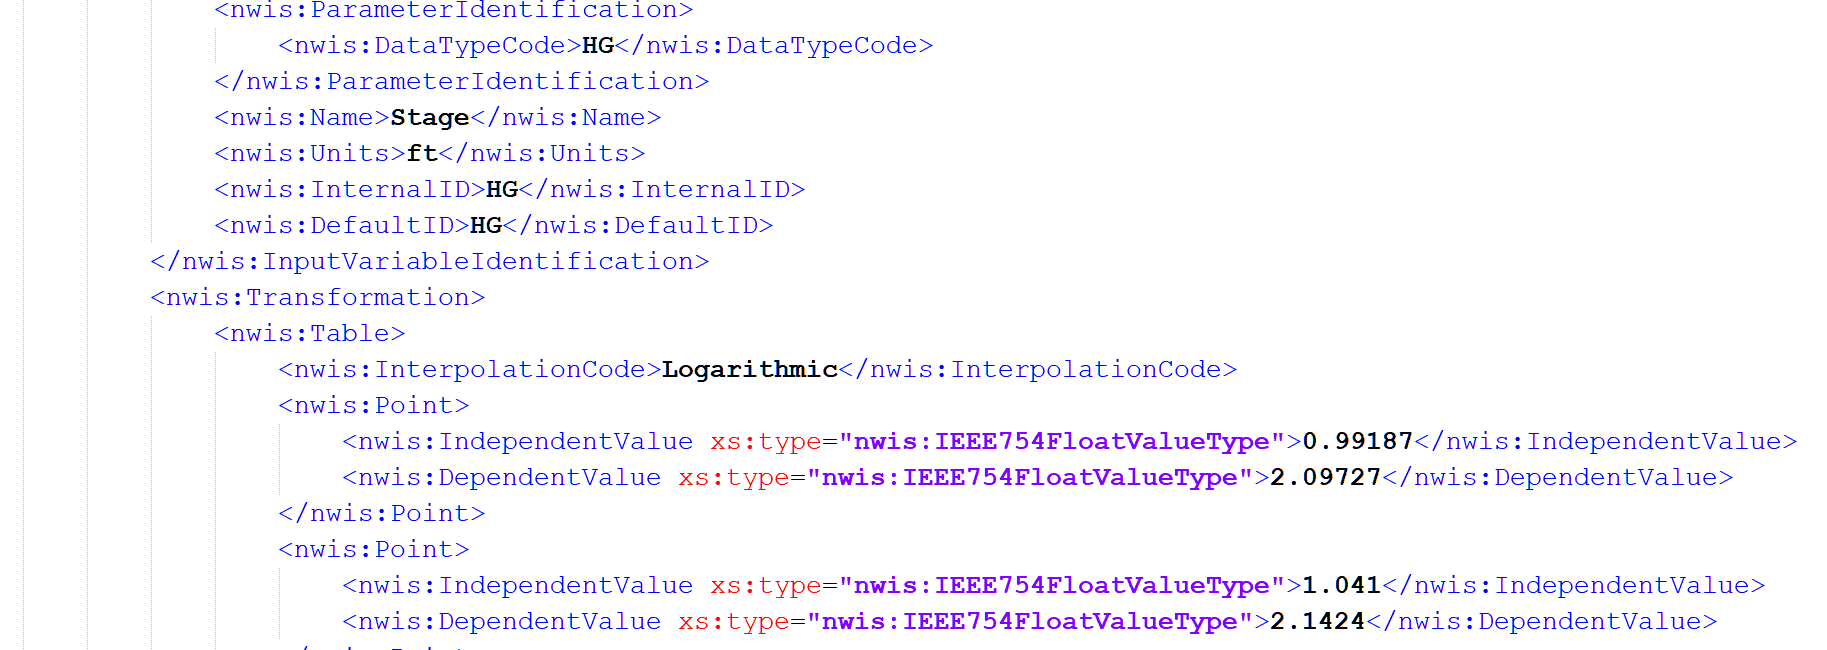
On the Aquarius support side, troubleshooting no longer looks like this, trying to trace where RDT values were set and checking them against the HydroML file (generated from many different code bases):
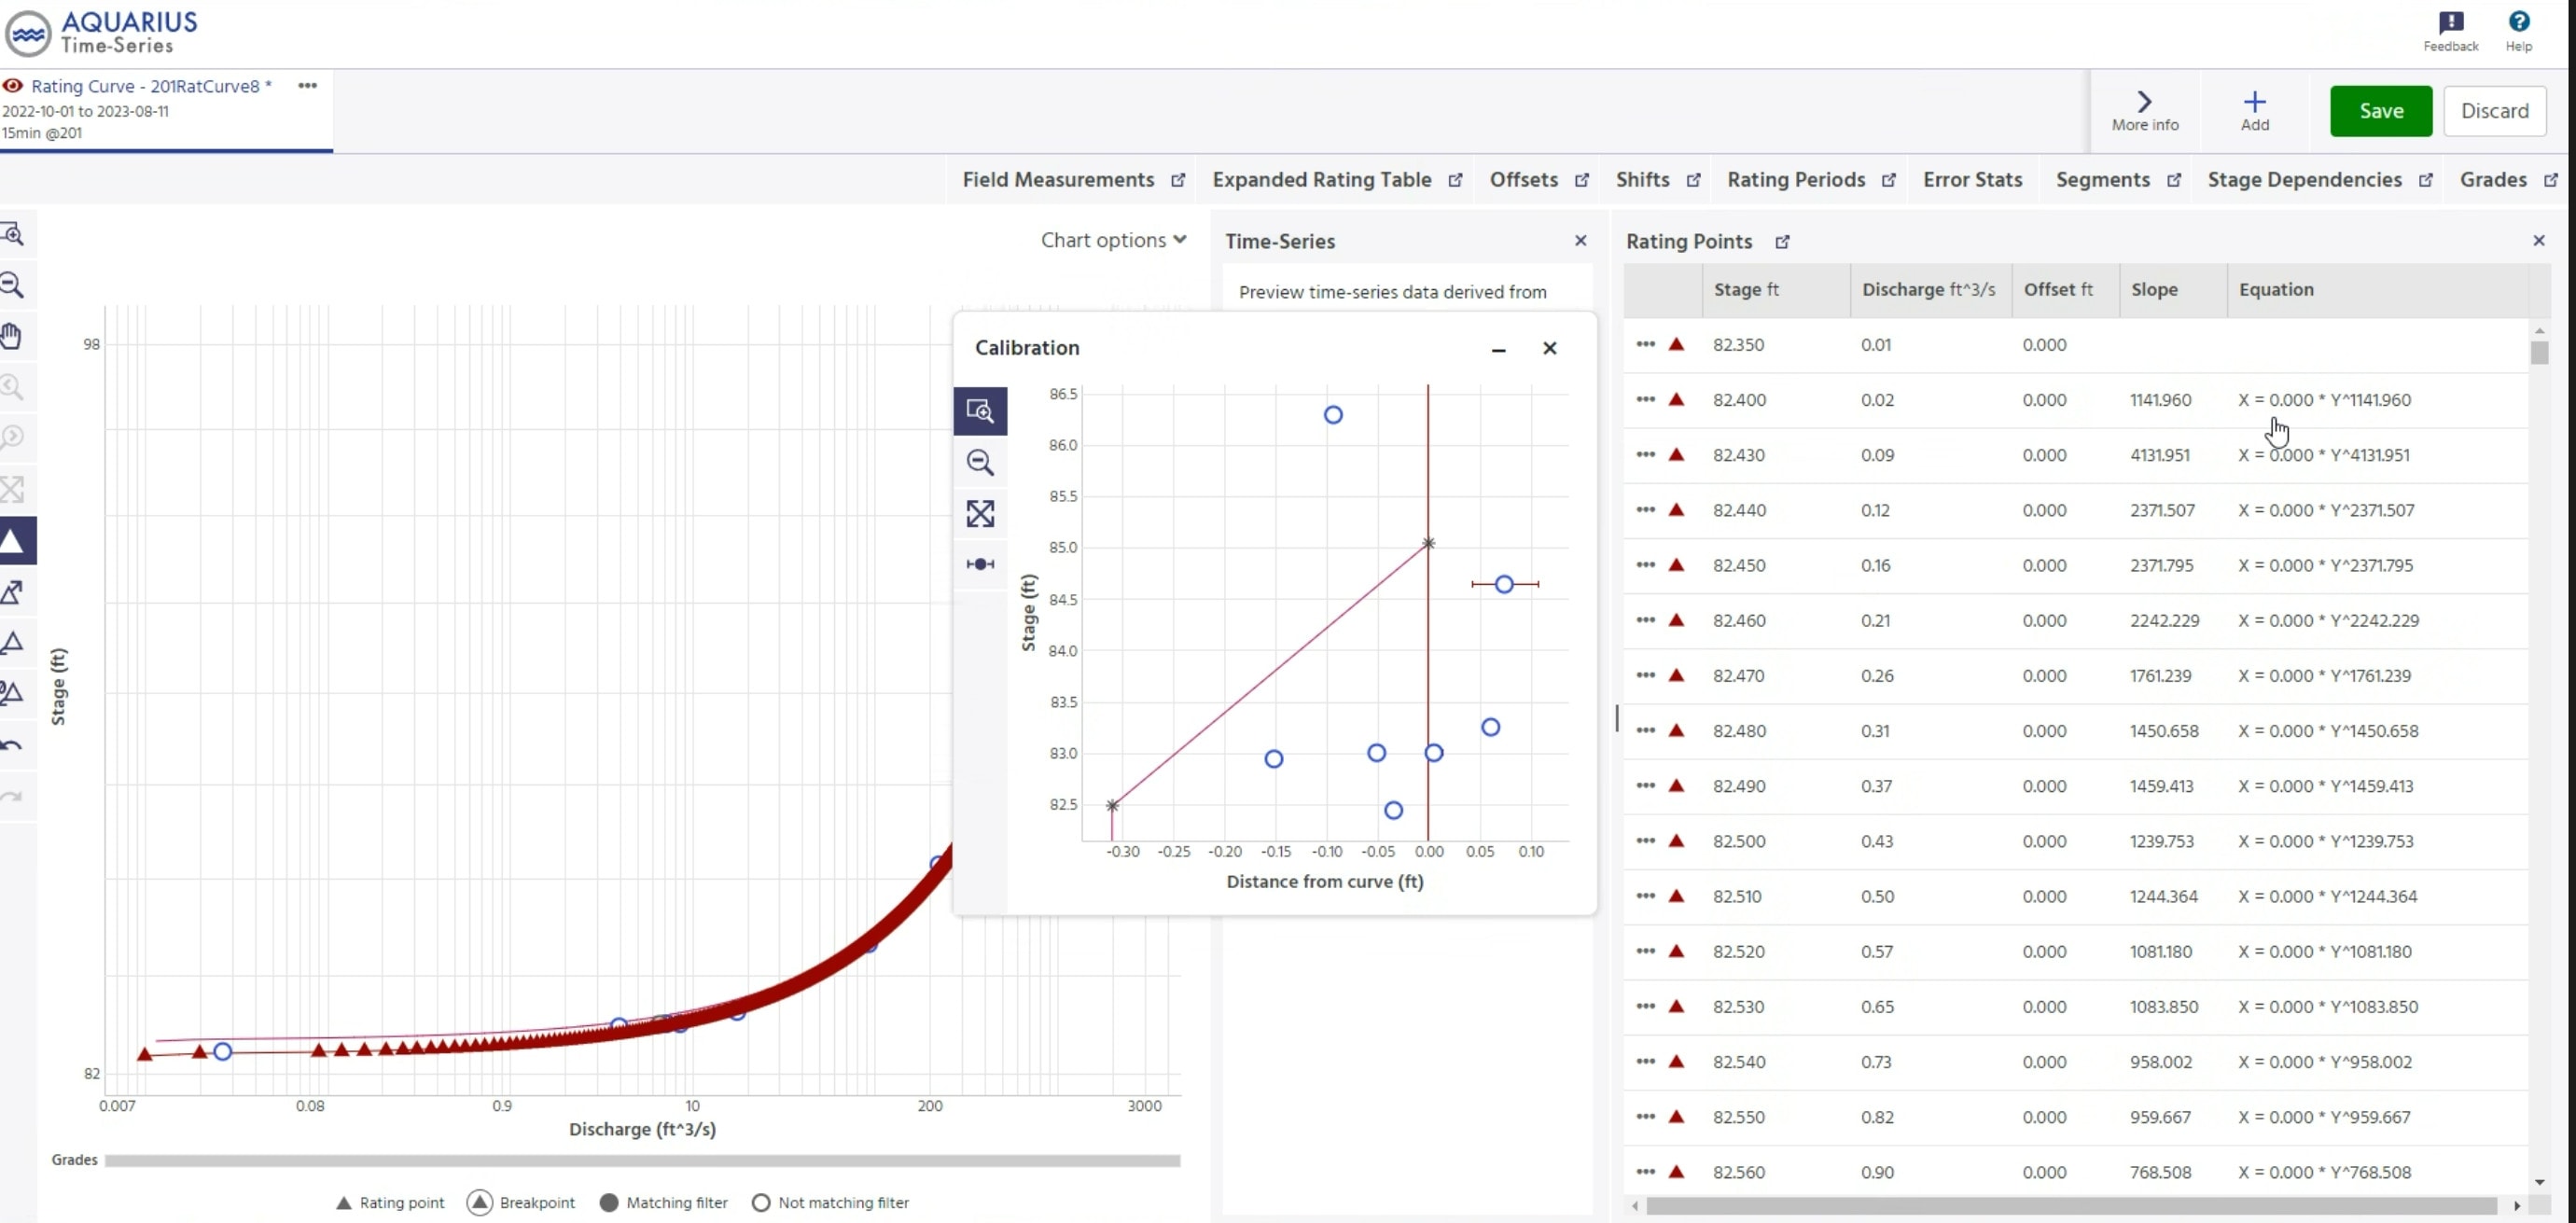
The New Era Begins: RRT
Over multiple years and iterations, we can now ensure all the core functionality for rating development can be done with the Rating Review Tool. There are a couple of things that could not be migrated, like the ability to see measurements used to make the old curves, but if you open the curve in RRT, and check the measurements, it sticks. We are excited to share that the functionality of RRT has now surpassed what you could do in the old tool.
RRT is finally ready. Yahoo!
Reasons why RRT is a vast improvement for your rating curves:
- Speed – it is much quicker to load your curves; it's a modern tool optimized for efficiency
- Ease of use - the interface is clean and simple, yet the tool is still powerful and awesome
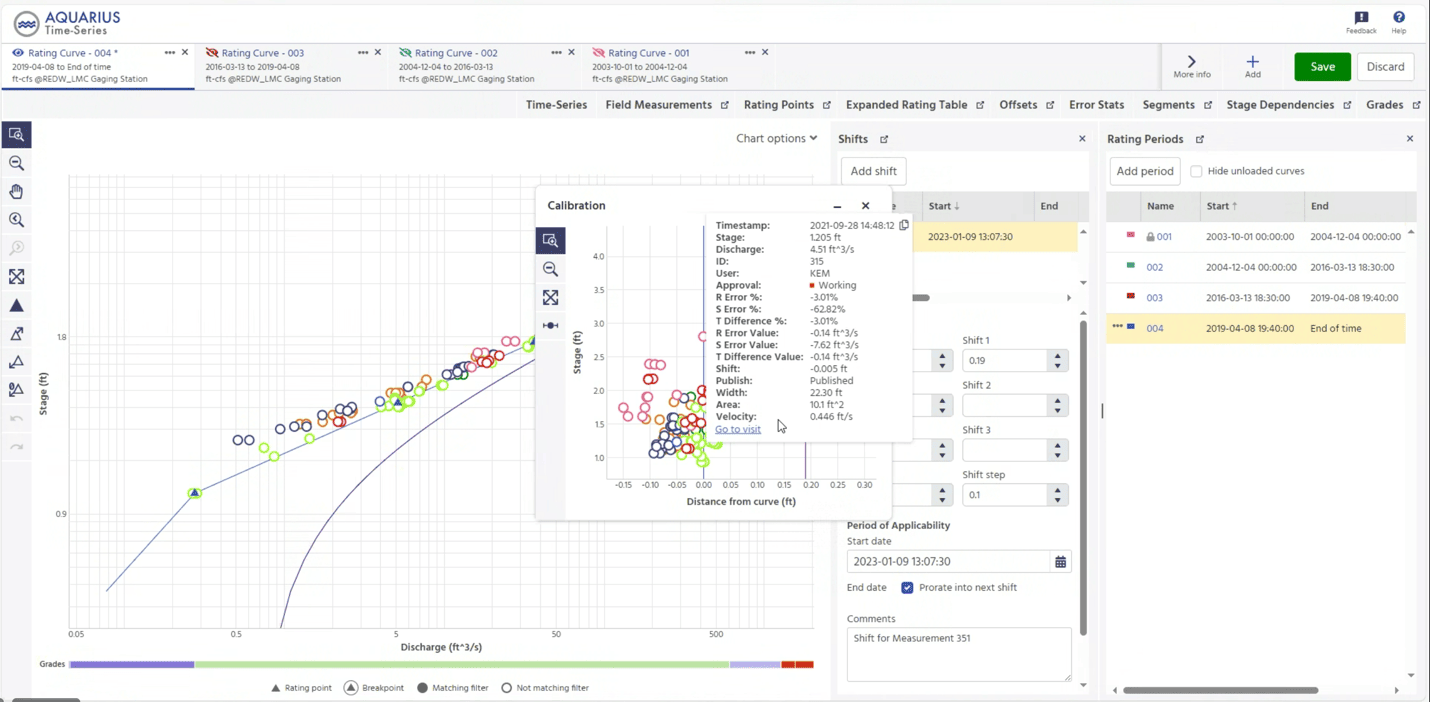
- It’s now easier than ever to create shifts (right-click on a measurement in the calibration pane and the timestamp and values auto-populate...)
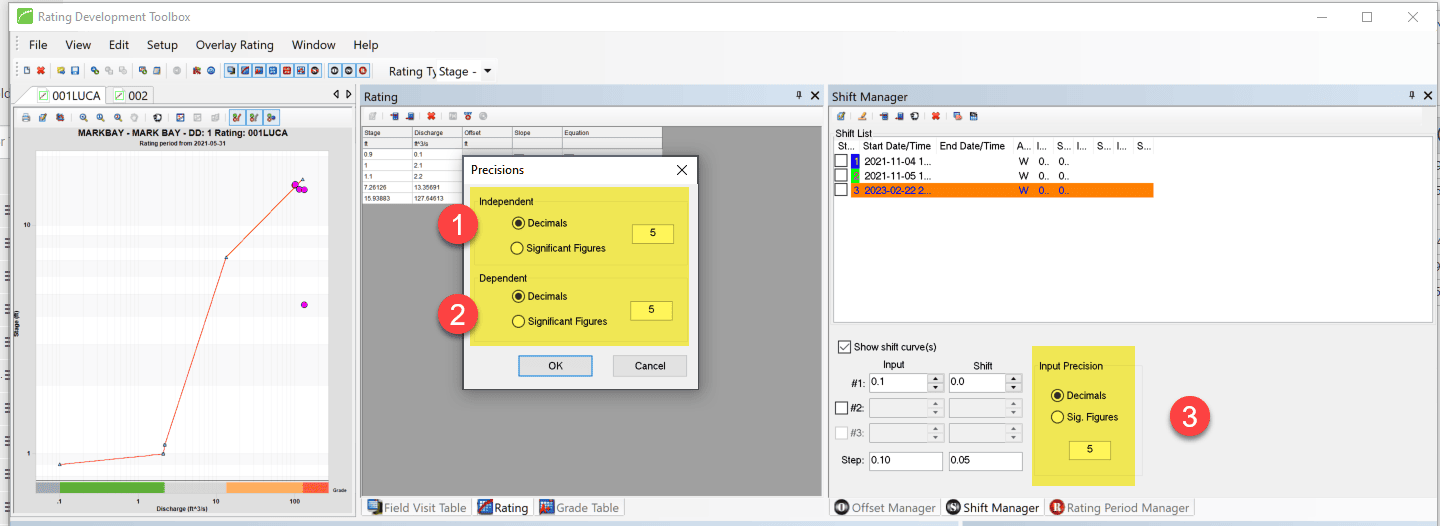
- Precision of dependent and independent parameters is managed system-wide
- You now have the ability to create a curve from a cross section
..and it is easier to learn how to do rating development! In terms of time savings, you would be saving days on training alone: No more does you or your team need to commit a week of training towards learning the ins and outs of all the different windows of RDT.
Recently, my colleague Grant and I had the privilege of working with a seasoned hydrologist at the Illinois State Water Survey who was new to the Rating Review Tool. Despite his initial reservations, he was pleasantly surprised by the tool's simplicity and effectiveness.
With just an hour of training, he was able to calibrate his imported rating curve with ease, highlighting the RRT's accessibility and user-friendly interface. That alone speaks to the impact we expect our customers to see with this new tool. This truly is a “New Age for Aquarius.”
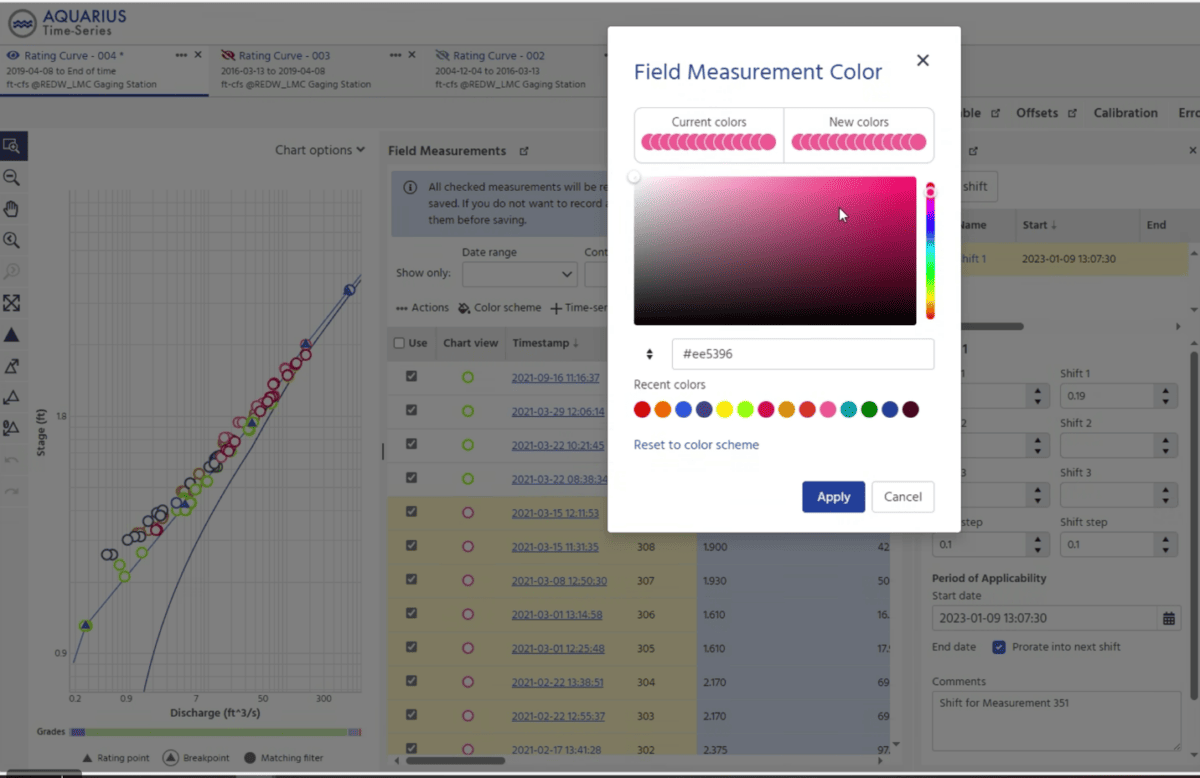
I was working with the team at the US National Park Service the other day, and Rachel was complementing us on the fact that field measurement colours now stick for her measurements, that she groups and manages with her own colour-coding. That was never sticky in RDT beyond a single user session but works a treat in the new rating Review Tool.
Learn More
If you have any questions about rating development or want to learn more about working with the new Rating Review Tool, check out the many resources in our documentation (RTFM!), Aquatic Academy (tons of videos about how to use RRT) and Aquatic Support Portal (workflows, info, and troubleshooting).
Whether you're a seasoned hydrologist or new to the field, the RRT's intuitive interface and powerful features make it easier than ever to analyze and calibrate rating curves.
And of course, if you just want to talk to one of us in the Support Team about it, open a ticket and ask for a web session. We would be happy to help. It's what we do.
About the Author
Mark Edwards is a Senior Customer Support Specialist on the Aquatic Informatics Team. He has been providing quality customer support and education to professionals within the water industry for 10+ years.
Find Your Partner in Change Management
As cities, agencies, and private organizations progress in digitizing their water monitoring program, one of the main challenges they face is resistance to change.
Technology partners can help organizations guide their change management strategies to ensure the success of any new technology projects. While every water organization is unique, many of the challenges are similar: legacy systems, data silos, lack of resources, etc.
Experienced technology partners like Aquatic Informatics have seen it all before. We can help you achieve streamlined quality control for your environmental data. From source water through to the receiving environment, our interconnected data management platforms can help you drive the efficient management of water information across the water cycle with minimal disruption to your operations.
Get in touch to discuss your water data projects, check out our upcoming product demo, or schedule a personalized demo of our platforms.