How to Get Better Flow Measurements Using the Rising Bubble Method
One objective of the Hydrology Corner is to provide a forum where hydrometric problems can be discussed and clever solutions to those problems can be shared.
The stream gaugers vs. beavers post is a good example of a discussion of a difficult problem. Not only have several people posted on the blog but the post also resulted in an email exchange with Jeff Watson from Horizons Regional Council who realized that New Zealand may have a solution to a North American problem.
New Zealand does not have beavers. They do have a wide variety of tricky monitoring problems and they have some very clever people working on those problems (e.g. heli-gauging for example).
One of the problems they are working on is the case when there are weeds in the stream.
Conventional monitoring lacks accuracy because 0.6 gaugings over-estimate flow and 0.2&0.8 gaugings under-estimate flow. ADCP gaugings fail because of insufficient depth and/or indefinite flow boundary.
Thomas Wilding of Hawkes Bay Regional Council, and the Instrument Systems Group of the National Institute of Water and Atmospheric Research (NIWA), have been working on this method in four stages:
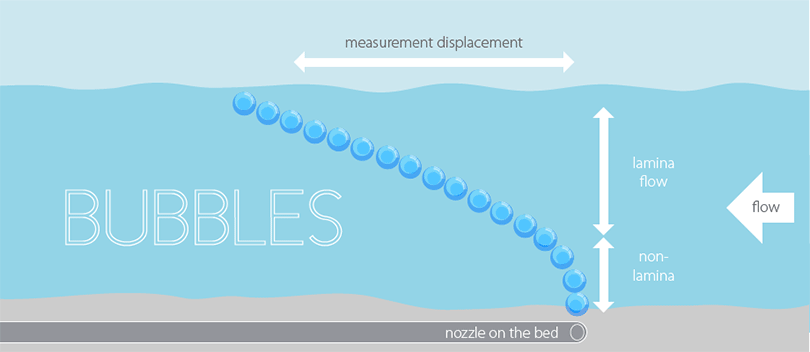
Stage 1) Stage one is described here “Better flow measurements in slow, weedy streams – using the rising bubble method”. It uses bubble rising velocity and surface bubble displacement area measurements to calculate flow rate. In order to get the displacement area for a single measurement you need to measure the displacement at about 20 verticals across the section, similar to a conventional gauging.
Field and laboratory experiments have validated the technique as being very reliable up to a velocity above 0.7 m/s. This limitation would never be a problem in a beaver-dammed stream. This technique may help with obtaining a measurement at, or very near, the gauge.
Stage 2) In stage two, the NIWA team developed a prototype Velocimeter for on-site measurement of bubble rise velocity, the first ‘half’ of the total discharge equation; it has better than 1% repeatability and is currently being refined.
Stage 3) Stage three is underway and will focus primarily on the second ‘half’ of the discharge equation. This will include trials with ‘evolved’ equipment ‘closer to the desired end product’. NIWA will publish an update in its web publication, Instrument Systems Update (#22), in April.
One problem with beaver activity is that you may be forced to go some distance upstream or downstream to find a suitable reach for a conventional area velocity measurement. This introduces additional uncertainty in terms of catchment area or hyporheic interchange flow. The flow regime required for bubble gauging is likely less sensitive to the assumptions of steady uniform flow and is likely not to suffer from as much uncertainty at very slow velocity (e.g. the other extreme).
Stage 4) In stage four, NIWA and HBRC will develop a fixed-installation gauging station to demonstrate remote-flow monitoring. If this is successful we may finally have a ‘beaver-proof’ gauging method.
Automating the method will definitely be a challenge. However, look at how rapidly technology is changing for gauge cameras and also for Large Scale Particle Image Velocimetry (LSPIV).
There is no time like the present to investigate enabling technologies for innovative monitoring.
What I would really like to see is collaboration between North America and New Zealand on the final stages of this project. For that matter, I would like to see collaboration between stream hydrographers anywhere in the world. We have no shortage of shared problems, both for discrete measurements and for continuous monitoring, what we need more of is shared solutions.


