Drones – Providing a New Perspective on Hydrometry
A different point of view changes nothing but it can change everything.
Last week I wrote about how unmanned Aerial Vehicles (UAV), also known as drones, could be used for Large Scale Particle image Velocimetry (LSPIV) to get surface velocity measurements, which when combined with surveyed cross-sections can produce extreme flow gaugings. That same drone, equipped with the same camera, can also provide the cross-sectional information needed to complete the job.
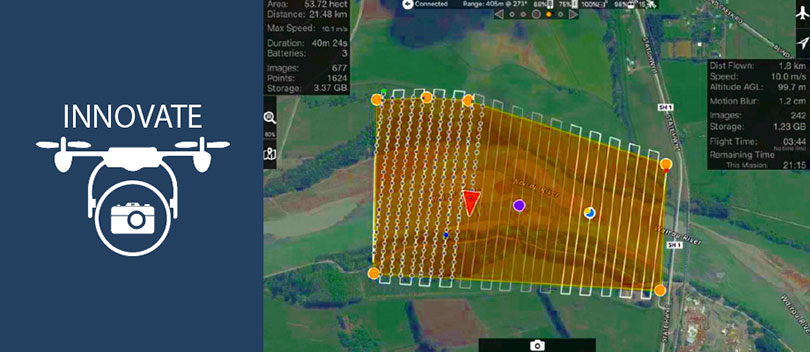
Mike Ede (Marlborough District Council) unveiled the results of a pilot project he has been working on at the Christchurch ratings workshop earlier this month. The project generated a high resolution orthorectified photo of a gauging reach; a high resolution point cloud (over 48 M points); a 3D textured model and a high resolution Digital Elevation Model (DEM). All of this information came from a Drone deployed for an hour to take over 800 photos from an elevation of 100m.
You could get the same results using ground-based or aerial Light Detection and Ranging (LiDAR) surveys. The cost of LiDAR is such that it is only used in very well-funded projects. In contrast, the capital investment for drone-deployed photogrammetry is less than then cost of an Acoustic Doppler Current Meter (ADCP). LiDAR is completely out of reach for most hydrometric agencies, whereas it is easy to imagine a camera equipped drone could be purchased for every field office.
LiDAR is generally more accurate that photogrammetry but with enough control added, photogrammetry can be almost as accurate. LiDAR images can be filtered to produce ground elevation beneath a forest canopy but this is rarely a problem for channel surveys. While it is true you no longer need a $1.5M helicopter and $500k LiDAR scanner, even a UAV borne LiDAR kit will set you back $200k. If you consider that the same kit that you use for reach-surveys can provide you with flood gaugings then the price of a UAV camera system looks pretty competitive.
There are a number of ways this high resolution information can be used.
An obvious objective is extracting cross sections. From a single survey of the gauging reach you can obtain multiple cross-sections. You may want to obtain standard soundings for each gauging section; a standard cross-section to use for a stage-area rating; and a cross section for the control section. Collecting the data before you decide where you want a cross-section is an advantage for LSPIV where you may not know where the optimal section to observe velocities is before the event.
Mike and his team did another test to compare two DEMs.
The difference between the two is a map of reach scale bed movement yielding volume of scour, volume of deposition and net volume difference for the reach. The incremental cost of drone surveys after capital cost and the establishment of ground control points is low enough that it is entirely feasible to do event-based monitoring of bed movement. This information about bed form and bedload transport could soon become a highly-valued by-product of hydrometric monitoring sought after by engineers and biologists.
Information about rugosity, sinuosity, bed material, vegetation and other hydraulic factors are stored in the orthorectified images and information about wetted perimeter, width, depth, area for any water level can be extracted from DEMs. This is a wealth of hydraulic information that could be readily accessible to inform the way we extend rating curves.
There are an increasing number of studies looking at developing rating curves from DEM data (e.g. Durand et al. 2016; Nathonson et al. 2012). These studies are inspired by the promise of remote sensing for flow monitoring. Essentially, by mapping the hydraulic geometry of the stream bed, inference can be made about the conveyance for any given water level elevation. While these techniques cannot hope to compete with ratings developed by gaugings they may be very useful for extending ratings to the extreme of record.
Technological change is a constant in hydrometry.
From the earliest Neanderthal who first stuck a stick in the mud to mark a water level to the present we have come a long way. However, the objective is still pretty much the same: Is it safe? Is there enough? Is there too much?