Event WIMS User Group: Inframark & The Fall River WWTP JUL 23 | Register today for our WIMS User Group in Fall River, MA, a local forum for water & wastewater professionals to learn, connect...
Event WIMS User Group: Hampton Roads Sanitary District JUN 26 | Register today for our WIMS User Group in Newport News, VA, a local forum for water & wastewater professionals to learn, connect...
Event WIMS User Group: City of Kalamazoo JUL 15 | Register today for our WIMS User Group in Kalamazoo, MI, a local forum for water & wastewater professionals to learn, connect &...
On-Demand Webinar Advanced Treatment Operations: Unlocking Value at Every Step Discover how to translate the data you’re already collecting into critical insights.
Event WIMS User Group: Capital Region Water AUG 26 | Register today for our WIMS User Group in Harrisburg, PA, a local forum for water & wastewater professionals to learn, connect &...
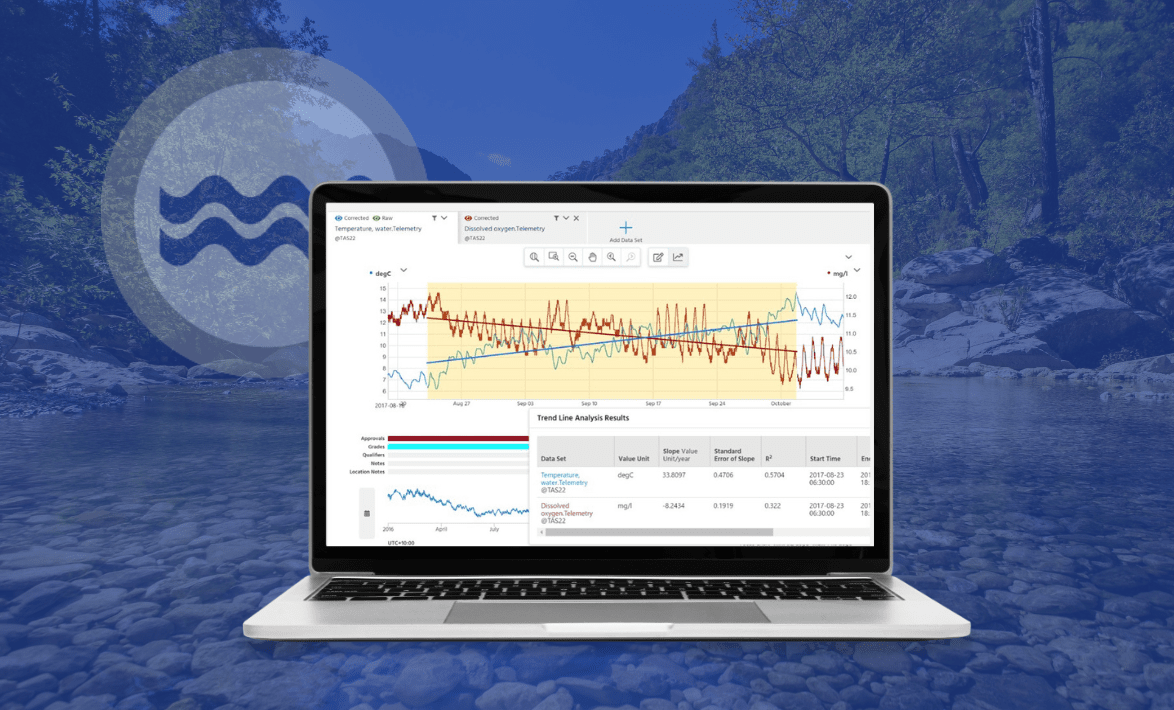
On-Demand Webinar / Aquarius Harnessing Data for Water Management: A Regional Council’s Innovative Approach Learn about how centralizing data for faster analysis ensures public safety & responsible water management.
On-Demand Webinar City of San Luis Obispo Streamlines Reporting & Response Times See how San Luis Obispo automated reporting to ensure compliance, improve outreach, and protect water quality.
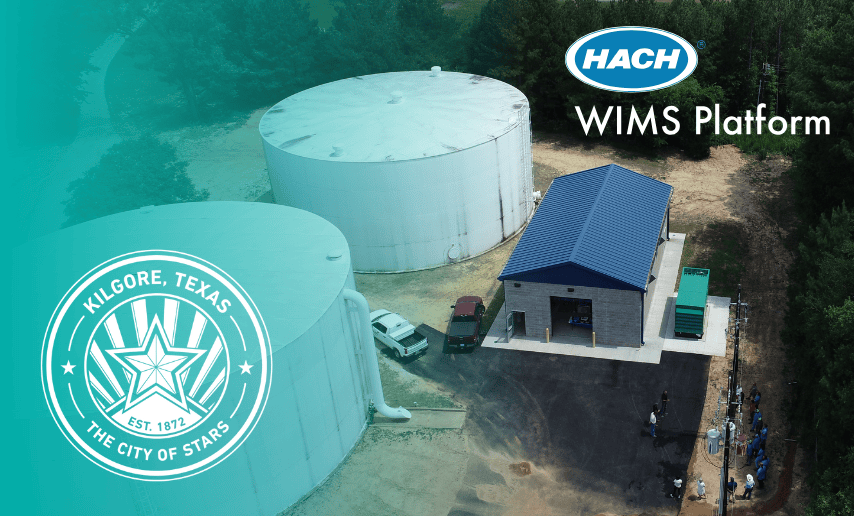
On-Demand Webinar Small Utility Unlocks Predictive Operations See how the City of Kilgore, TX, tackled water quality challenges using WIMS Rio – taking the first step toward smarter water management.
Case Study / Aquarius Panama Canal Optimizes Shipping & Water Quality by Leveraging Aquarius Panama Canal leverages Aquarius software to optimize shipping through the canal while protecting local water supply.
On-Demand Webinar / Aquarius A Flood of Data: Best Practices for Advanced Stormwater Insights Discover how to leverage real-time stormwater data to gain critical insights for better resource management and faster response.
On-Demand Webinar Automated Operations: Overcome Workforce & Skill Gaps Begin your journey of bridging the gap & empowering your workforce with automated processes, simplified reporting, and actionable insights.
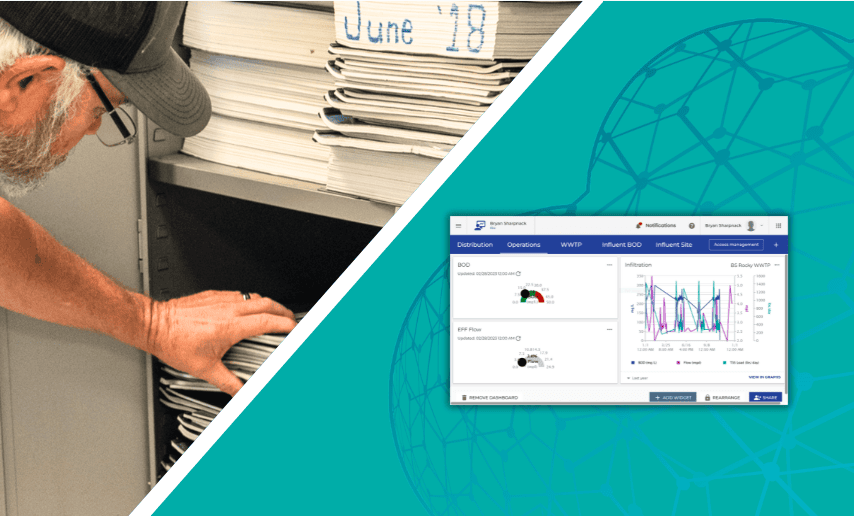
On-Demand Webinar / WIMS Clipboard to Cloud: How Cloud Tools Enhance WIMS Learn how your plant can access, collect, and analyze critical data in real-time, all while proactively identifying risks and streamlining operations.