![]()
Analytics Software for the Natural Environment to Monitor Flooding, Water Quality, Stormwater, and more.
Aquarius extends the value of data with powerful tools that enhance water resource management.
Extend the value of your existing investments, third-party sensors, or systems by normalizing any type of data to manage, qualify, and analyze centrally.
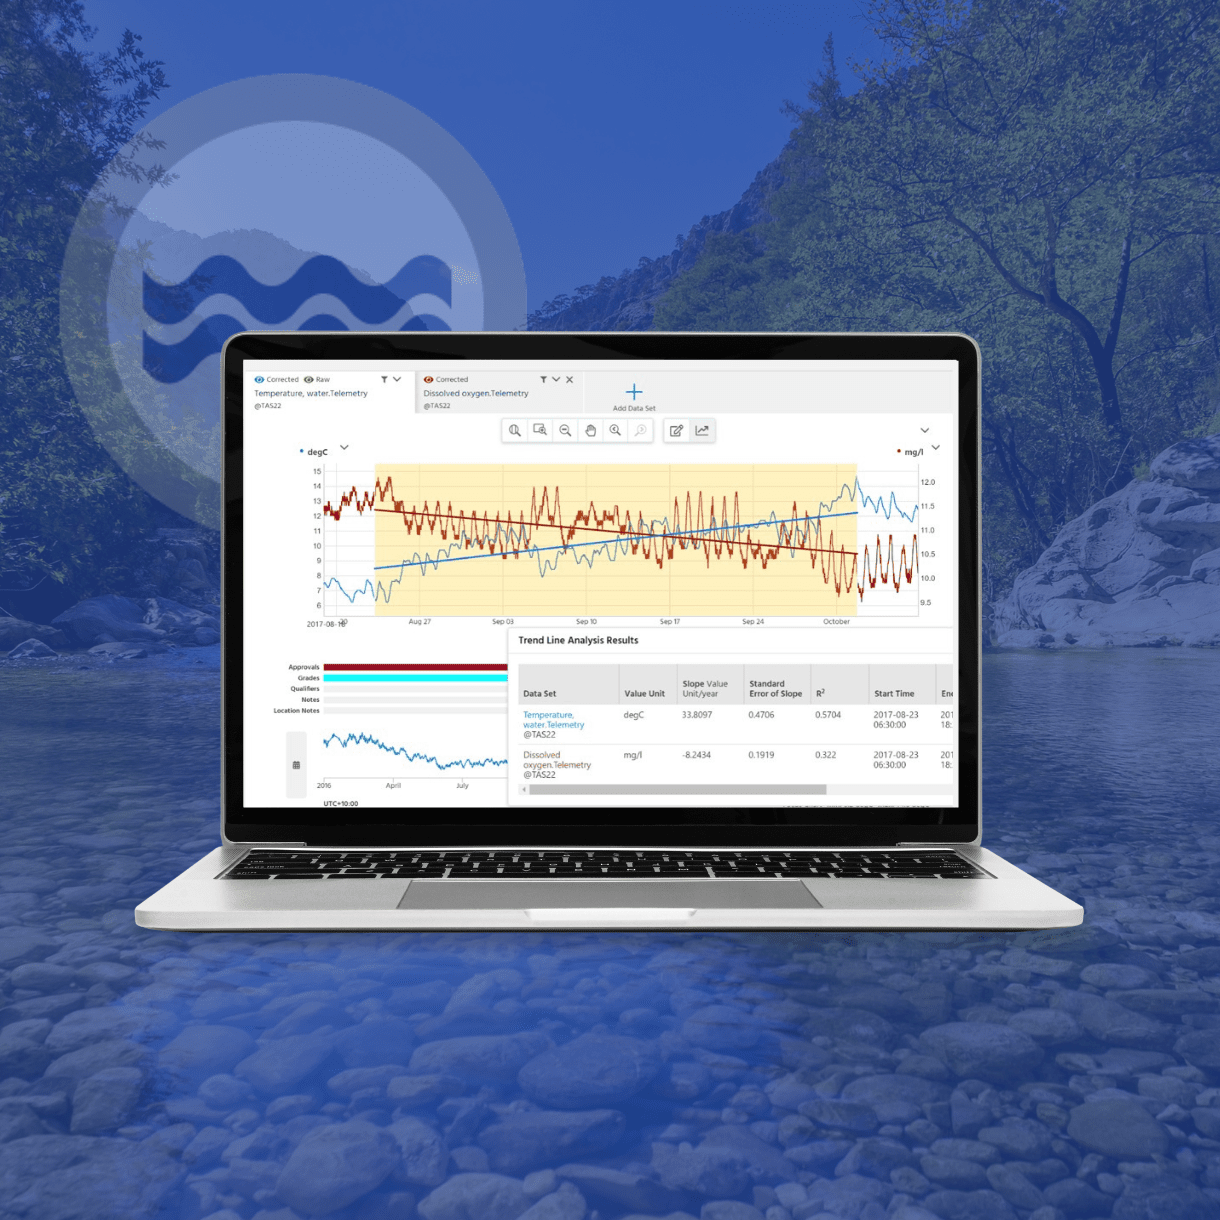
Easily visualize, scan, and QA/QC your data with best-in-class rating curves, automated error detections, and intuitive correction tools that compare historic time-series or discrete data, with a defensible audit trail.
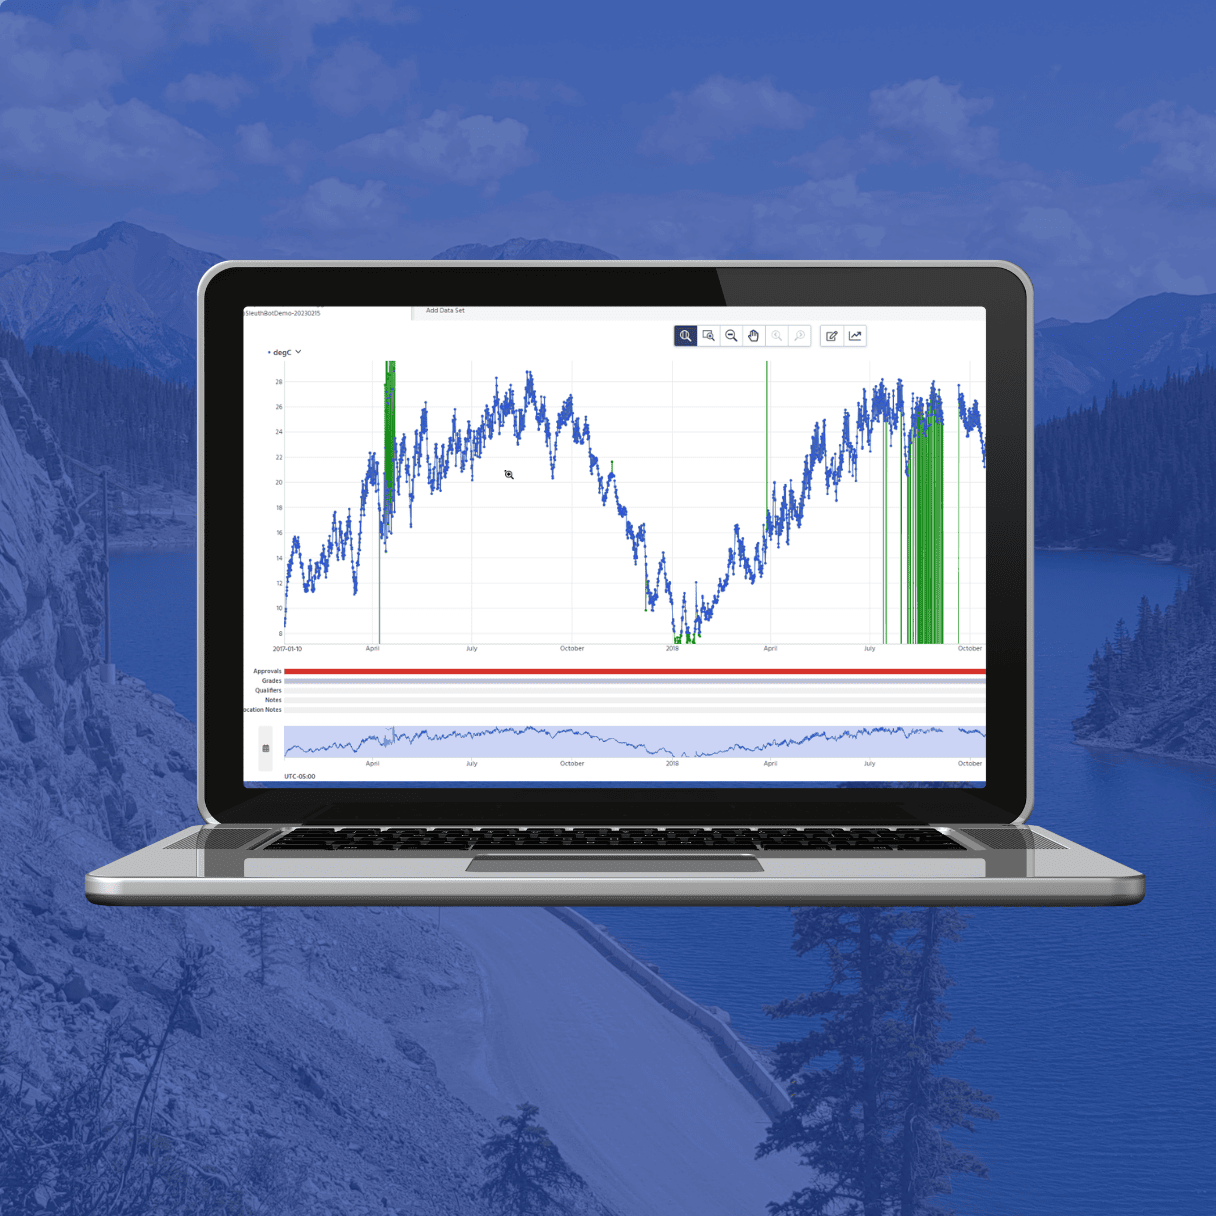
Powerful charts and contextual visualization functionality to forecast and convey technical and non-technical information in real time for faster decision-making.
Aquarius Cloud: Why Leading Environmental Firms are Making the Move
Aquarius Cloud is a fully managed, cloud-based SaaS solution hosted on Amazon Web Services (AWS). By migrating to Aquarius Cloud, organizations eliminate the need to manage infrastructure maintenance and software upgrades, reducing IT overhead and simplifying system administration. This allows environmental teams to focus on their core operational objectives rather than spending time and resources on platform maintenance, while benefiting from a secure, scalable, and continuously updated cloud environment.
Trusted by leading monitoring agencies
Security is built into every layer of Aquarius Cloud software. Explore how Aquatic Informatics' expert-led information security program combines dedicated security professionals, rigorous governance, and industry-leading standards to protect your data, reduce IT overhead, and ensure reliable, resilient cloud operations.
In the past, evaluating the impact of these heavy rain events required multiple spreadsheets and hours of manual effort. Now, with the push of a button, the software can create and retrieve customized intensities to evaluate isolated street flooding and protect the city against liability

Efficient, Accurate & Defensible Water Data
A Single Source of Truth
Environmental data from multiple sources are securely stored for fast, central access to easily correct and quality control data, build better rating curves, derive statistics, and report in real-time to meet stakeholder expectations for timely, accurate water information. You can unify your data to establish a smart water monitoring system for flood analysis, real-time water quality monitoring, predicting water availability, and water compliance.
Sample Management Made Easy
Streamline the collection and management of environmental lab and field sample data, saving time while increasing the quality of final data. All your discrete water, air, soil, and biological data are securely stored and validated online for rapid analysis and visualization—so you can make better decisions anytime, anywhere.

Transform Data into Meaningful Insights
Contextual Visualization, Maps, & Dashboards
Stakeholders internally or externally can self-serve quality-assured data, real-time statistics, user-specific dashboards, and set custom parameters to easily see status indicators and deliver warning notifications. You can respond quickly to flooding and weather events with proactive communication and decision-support to better manage stormwater and infrastructure.
Share Information with Confidence
With streamlined QA/QC capabilities and a rich audit trail, your team can rely on the information to be accurate, timely, and defensible. Use predictive analytics, trend analysis, and contextual alerts to help you react to environmental events faster than ever before.
Your New Dedicated QA/QC Assistant
Analyze your organization’s approach to QA/QC and receive rule recommendations to accept or reject based on your use case.
Manage rules and alerts easily from one intuitive dashboard that centralizes data correction suggestions, rule changes, and alert parameters to adjust quickly and conveniently.
Access insights faster with more reliable data, thereby increasing trust for informed policy-making, emergency event response, climate change adaptation, and research.
Automate Your QA/QC Workflows
Review Data Your Way & Standardize Quality Control
Retain full visibility through a detailed and easy–to- understand audit trail, enabling you to oversee the process with the flexibility to approve or reject the tool’s actions and suggestions. HydroCorrect empowers data quality standards across the organization, ensuring a uniform QA/QC process that does not leave room for errors.
Share Information with Confidence
Unlock time and resource efficiencies with automation that leverages user-defined rules that can be applied across your network. As you expand your monitoring program and your data volumes grow, the tool scales to provide reliable automated data reviews and corrections.
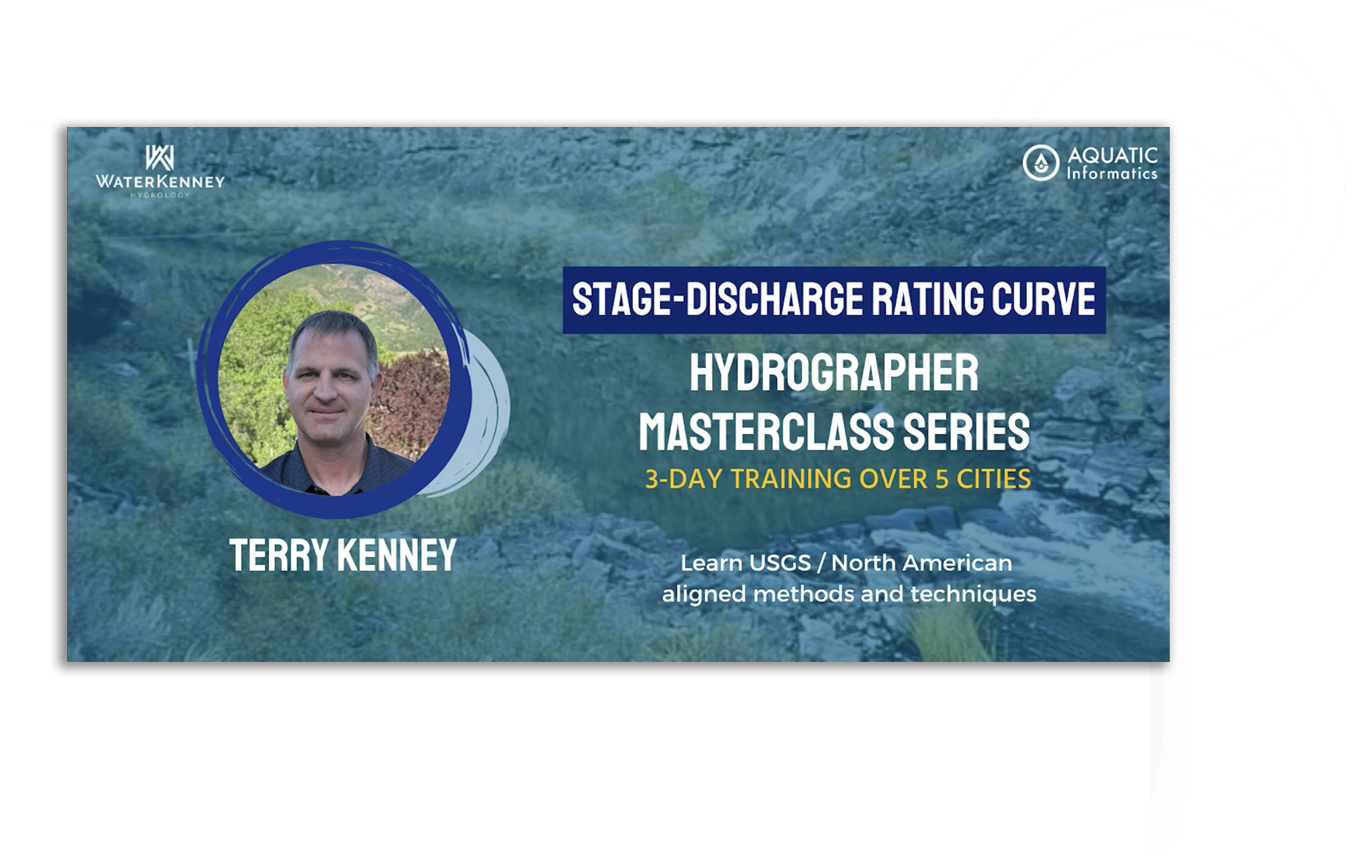
Watch the WebinarEmpowering Hydrologists & Industry Experts to Make Data Driven, Smart Decisions.
And with Aquatic Informatics, itʼs not just software...
Connect with a support specialist whenever you need assistance, or Access a growing library of on-demand videos, tutorials, and guides 24/7 in the knowledge base to discover learnings at your convenience.
Regular software updates and enhancements to ensure the evolving needs or your organization are being met. Help shape the future of our software by submitting ideas and requests in our online community.
Using the power of business to solve social and environmental problems, we’re committed to the highest standards of sustainable practices, public transparency, and legal accountability to balance profit and purpose.

Crossing The Chasm From The Old To The New
Eliminating data silos across the water cycle.