Aquarius WebPortal extends the value of data with powerful tools that enhance water management.
Organizations can easily & safely share environmental data with staff, departments, consulting firms, cooperating agencies, and other organizations - improving collaboration and productivity.
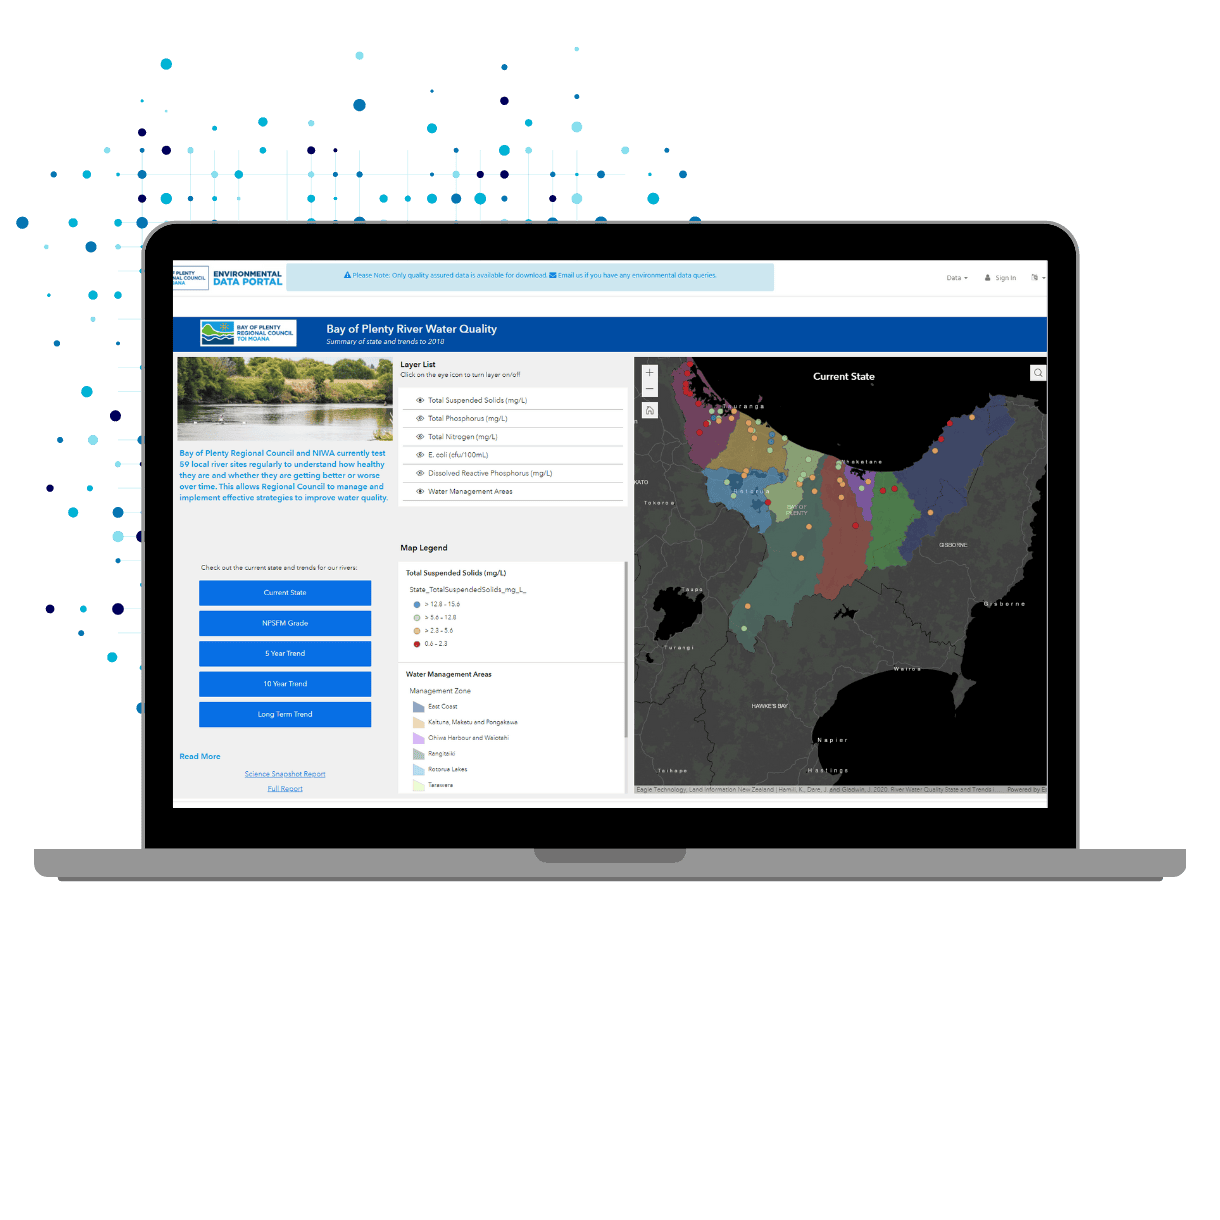
Interactive maps, real-time data, and live reports give citizens a rich view of the conditions of their freshwater ecosystems. An informed community is a safe and prosperous community.
Equipped with a real-time and historical view of drastic events, officials can better prepare for and more effectively manage floods, improving the safety of citizens while protecting public infrastructure.
WebPortal Walkthrough
Aquarius WebPortal delivers a simple and elegant solution for offering real-time online access to quality assured environmental data and services. Impress your stakeholders with rich statistics, intuitive maps, email alerts, data exporting, and live reports.
Aquarius WebPortal allows monitoring agencies to securely publish and analyze a wide range of environmental data services, including drinking water quality data, real-time water quantity information, watershed health statistics, rainfall data, or air quality indicators.
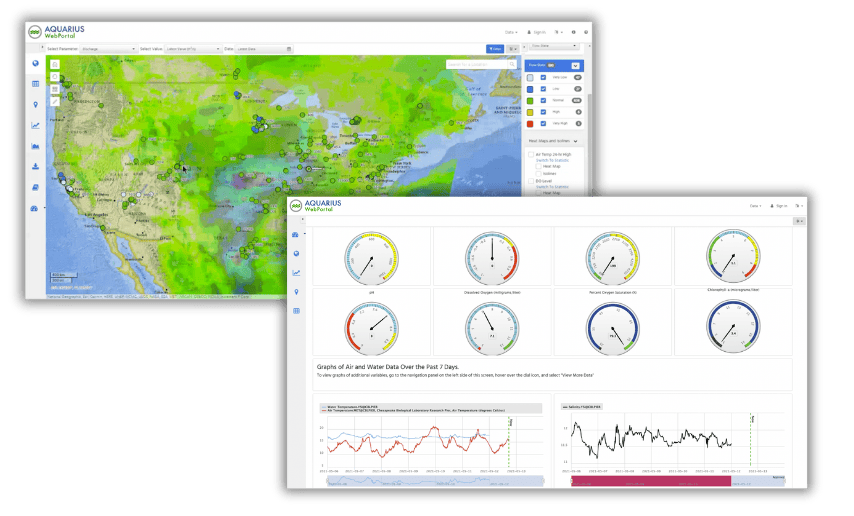
Gain Insights at a Glance
Configurable dashboards provide a live snapshot of environmental conditions – like current water or air quality states, flooding locations, rainfall statistics, or rising reservoir levels – making it easy to zero-in on the most critical data. Powerful widgets can display both Aquarius WebPortal and external data. Visually rich dashboards can include charts, grids, meters, webcams, YouTube videos, and Twitter timelines for a compelling view of environmental indicators.
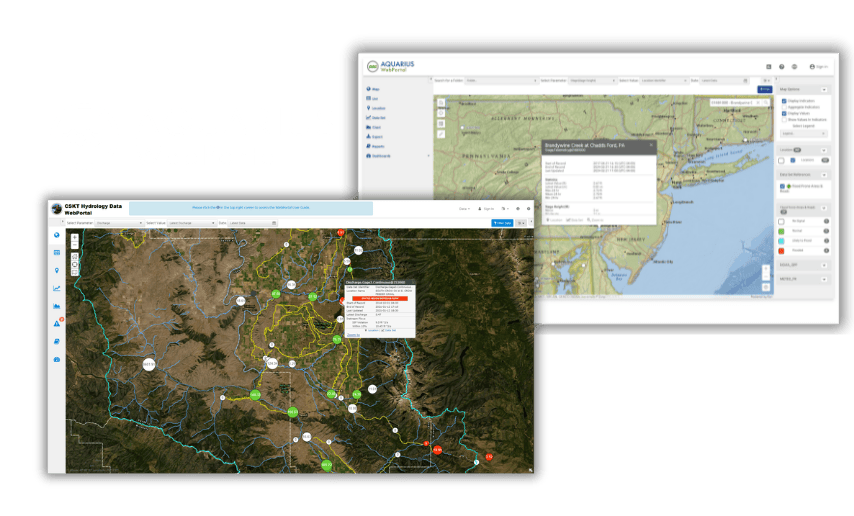
Provide Interactive Online Access to Real-Time Data
Stakeholders get on-demand access to quality-assured data, real-time statistics, and continuously derived computations. An interactive map allows you to zoom into the desired area, pinpoint a location, and popup a full list of calculated statistics. You select the desired parameter (like rainfall) and statistic for primary display. Colour codes provide a visual display of hydrologic and water quality conditions.
Impress with Maps, Data Grids & Charts
The modern graphical interface allows you to quickly visualize water data through maps (ESRI, Satellite Imagery, and OpenStreetMaps), data grids, and charts. Contextual information is displayed. Charts can be used to overlay multiple series of data, including different types of data, such as lines, columns, and points. Heat maps provide colourful displays of statistical data like rainfall and air temperatures across geographic areas. By providing a highly visual and interactive environment, Aquarius WebPortal speeds analysis and supports better decisions.
Get in Touch
Transform Data into Meaningful Insights
Give Rich Access to Historical Data & Statistics
Exploring historical data and derived computations is intuitive. You can easily see one day to a year’s worth of data. Setting data filters, ordering, and selecting date ranges helps quickly find the required information. Data can be summarized on a daily or monthly basis, with aggregating statistics.
Offer Exporting, Info Requests & Reporting
AQUARIUS WebPortal allows stakeholders to extract and save the information they need. With one click, environmental data can be exported to Microsoft® Excel, Adobe® PDF or CSV from any chart or data grid. Reports are also available in Adobe® PDF format with one click. Information requests can be used to display real-time reports or request information via email or Short Message Service (SMS) when working remotely.
Case StudyExplore a Live Aquarius WebPortal
