Share Information with Confidence
Hear from our Senior Customer Support Specialist Mark Edwards on how government agencies and municipalities from across the world are leveraging Aquarius WebPortal to monitor water data.
While showcasing their portals in real time, we will walk you through case studies including the City of Orlando, International Boundary and Water Commission, Environment Agency’s Community Flood Hub, and other agencies across the globe.
Discover how you can upgrade your water monitoring program by securely publishing the data you’re collecting to ensure defensibility and compliance, empower stewardship, foster awareness, and better protect your community against extreme events.
View now to learn:
-
- Intelligence: Extract meaningful insights from your visualized data
- Context: Make latest data contextual to historical trends with parameter ranges and overlaid charts
- Availability: Easily share QA/QC’d data with stakeholders. Get the right data in the right hands at the right time.
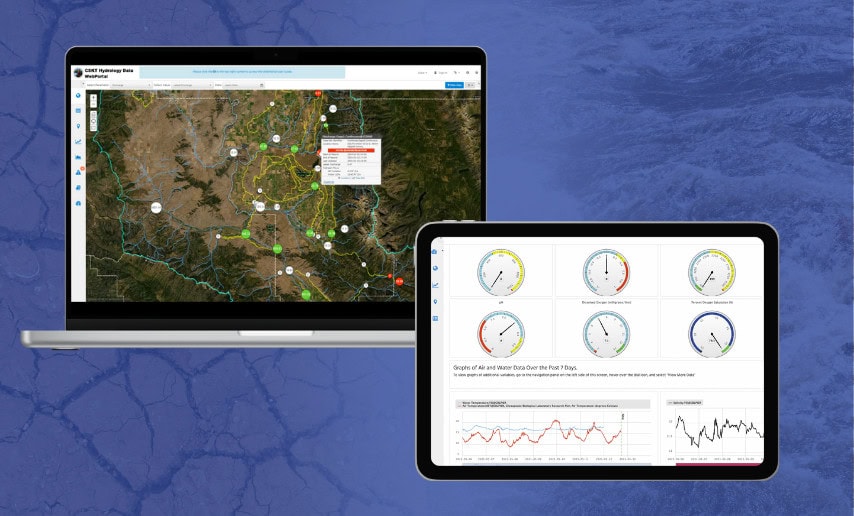
- Variety: Present your data in a variety of ways such as dashboard charts, gauges, schematics, reports, and grids in order to share insights with your community, customers, regulators, or board members
- Alerting: Highlight data currency or threshold breaches with emails and text messages to keep stakeholders informed
Tune in to learn how to impress staff, other departments, cooperating agencies, or citizens with rich statistics, intuitive maps, alerts, data exporting, and live reports!

Your Speaker: Mark Edwards
Senior Support and Training Specialist, Aquatic Informatics
As part of this role, he delivers hydrometric software training around the world. Mark Edwards has over 10 years of experience in supporting customers extend the value of their environmental monitoring program through centralized data management.
View Now
We now know what to look for and how to respond based on the data. For example, a lot of rain in a certain area is likely to cause street flooding because of debris obstructing storm drains. Reviewing the data allows us to determine if the flooding is caused by an under designed system, or if it is simply an occurrence due to mother nature. For this case, we will dispatch crews to the area before we get customer complaints.