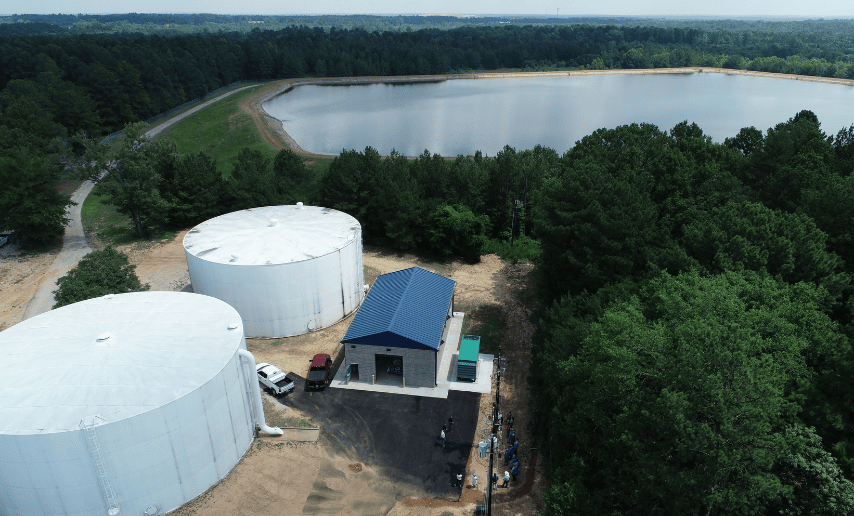

The City of Kilgore, TX delivers clean water to around 14,000 residents over roughly 160 miles of distribution lines. Five operators manage the City’s water, and a big part of their job is collecting data such as flow, pressure, chemical usage, and disinfection residuals. The City has a 3.5 MGD surface water treatment plant, a 3.5 MGD groundwater treatment plant, and seven groundwater wells. To manage the water flow between these facilities there is a raw water pump station, two water pressure plants, and over four million gallons in storage facilities.
Clay Evers is the Director of Public Works for the City of Kilgore and manages the operational data for the water treatment plant. “We have multiple filing cabinets of daily data sheets completed by our operators. I enter most of the production data into Excel when I have time or need to do a report or troubleshoot a problem” said Evers. “We do capture some data in our work order management system, but it is in a SQL database, so you have to mine the data, which is essentially cutting and pasting into a spreadsheet to create graph trend lines. It’s challenging and requires a certain level of sophistication and it is labor intensive.”
Nitrification Event Drives Need For Transformation
Late last year the City had a nitrification event and was unable to keep acceptable chlorine residuals in the distribution system. Evers started entering data into Excel to look at trend lines and see when this had started and if he could determine where and why this happened. “By graphing out the data in Excel, I could see the trend started three months prior. This was a real eye-opener to the fact that we really need to be able to analyze our data every day, and we needed a program that makes it really easy for all our operators to use and see what is happening and flag potential issues as soon as they happen,” said Evers.
This event led to a free chlorine conversion which involves removing ammonia (needed to form chloramine) from the treatment process and disinfecting the water with only chlorine. This was followed by flushing a lot of water. Evers and his team also needed time to diagnose the problem that needed to be rectified. These kinds of events are costly and preventable with a modern data management program like Rio, a software program for regulatory compliance and operational data management.
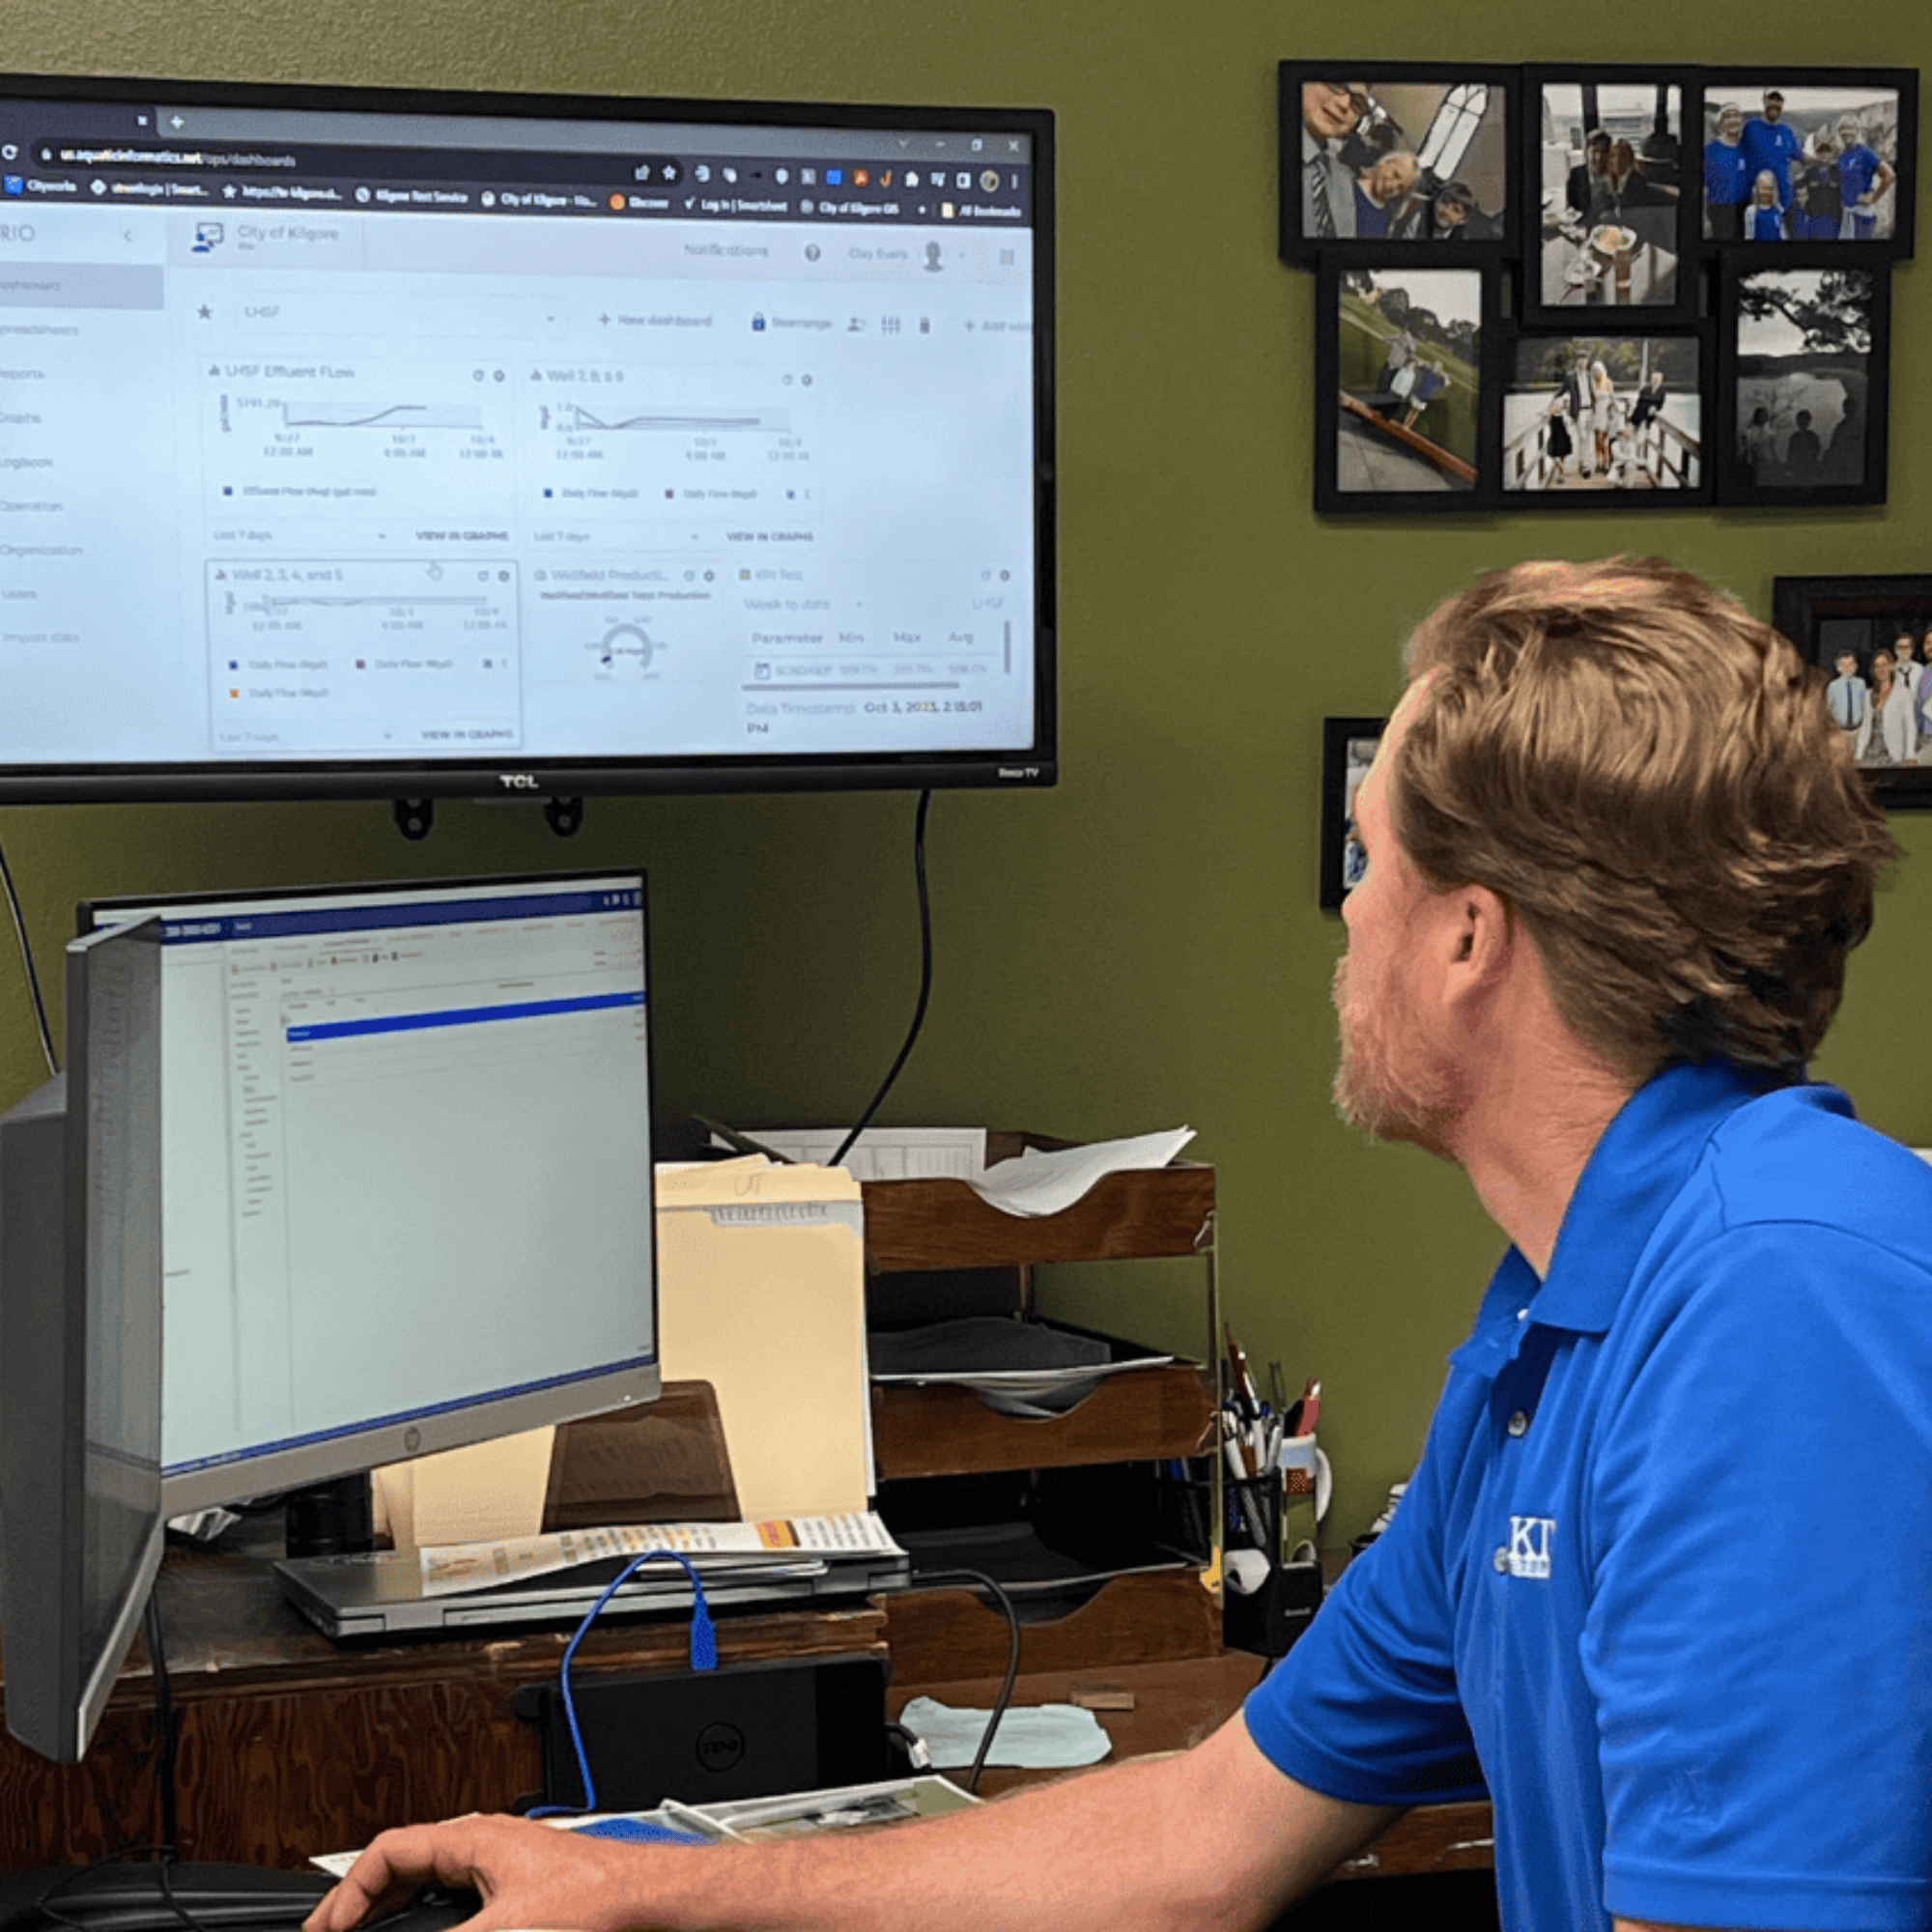
Using Rio, we now have this information at our fingertips – it’s fully automated. With one click we can graphically see the entire month, and soon the year. This will help us to identify anomalies, predict how much water we need, and help with conservation efforts.
Interfacing with SCADA for Faster Reporting
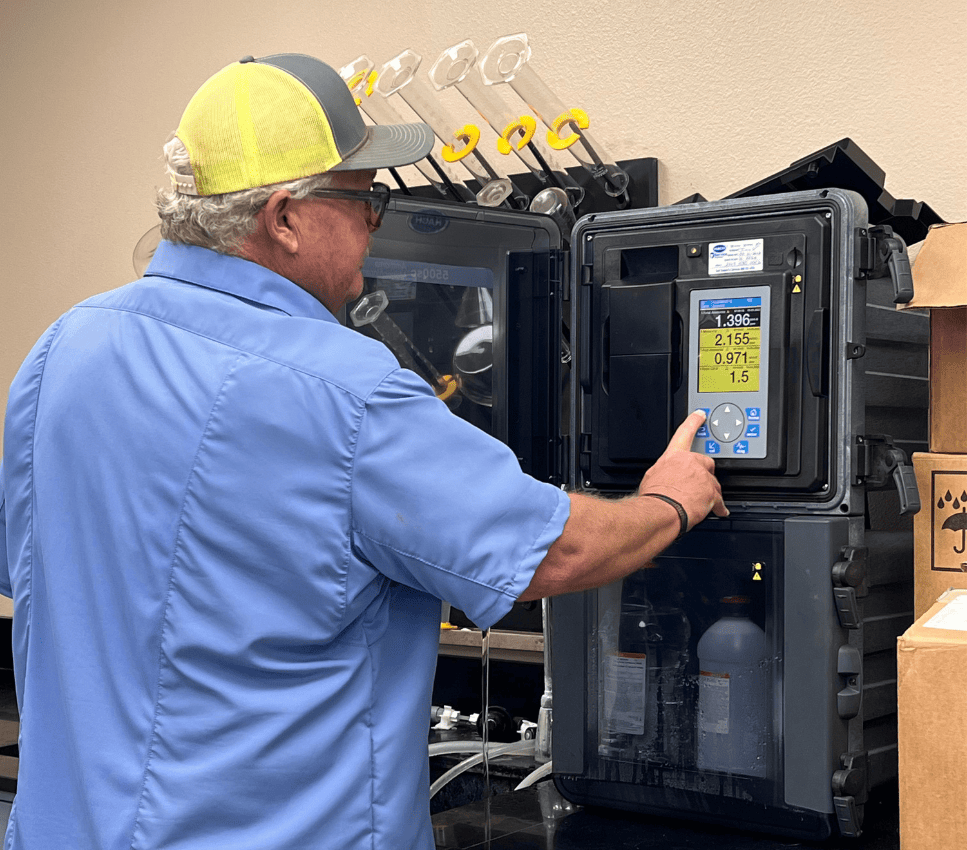
Rio is also interfacing with the City’s SCADA databases, “The software does the math on all data collected by SCADA, including filter turbidity and chlorine residuals, and gives the minimums, maximums, and averages which I also need for monthly reporting. I can compare SCADA data with operator’s entries and catch errors much more easily,” said Evers.
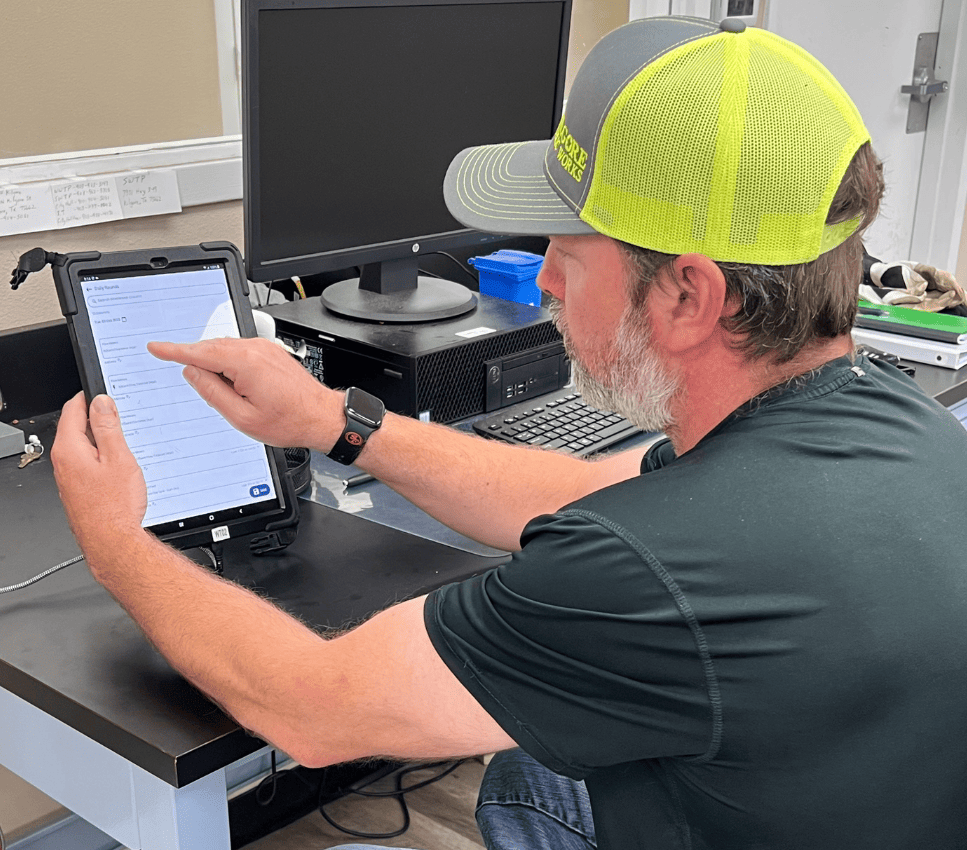
A couple of operators are now entering data through the Rio mobile app, while others prefer using a desktop to enter the data. The mobile app can run off any smartphone or touchscreen tablet, which is often more appealing to the new generation of workers who grew up with these devices.
Before implementing Rio, monthly operating reports (MORs) took several hours for operators to complete, as it was a manual process of finding the right data and entering it. The origin of most of this data, such as flow, residuals, and turbidity, comes into the program from SCADA. Once a variable is entered into Rio it automatically calculates and populates data into the MOR, dashboards, trend lines, and any other reporting templates that the City chooses.
Streamlining Operations with Data Visibility
In a couple of clicks Evers can now graph flow or chemical usage, or any other measured parameters to ensure operations are running smoothly or quickly identify anomalies. In one example the City had an unseen leak in a chemical line, which was clear to spot on a graph in Rio as it showed two simultaneous days of usage at 75 lbs, but typically the treatment plant uses 150 lbs.
Accumulating data and having it all in one accessible program, increases the value of the data over time, not only for predicting future outcomes, but in instances where the plant needs upgrading. Having the data at your fingertips is invaluable when a consulting engineer asks for 5 years worth of operating data to begin designing plant improvements. Good data ensures the right sizing.
“If you have the right tools built by people from the industry you can make better decisions. What I like about Rio is it’s easy to implement and well-priced, it’s already saving us time and as we get into using more of the functionality, I can see our capabilities expanding which is important for a small utility like ours. We have the same requirements as the bigger utilities, but we have fewer resources to achieve the same result – safe drinking water.”
Having this visibility and all the calculations to give us the numbers we need for analysis, and visually see it on a chart, means it’s hard to miss and we can quickly address issues.