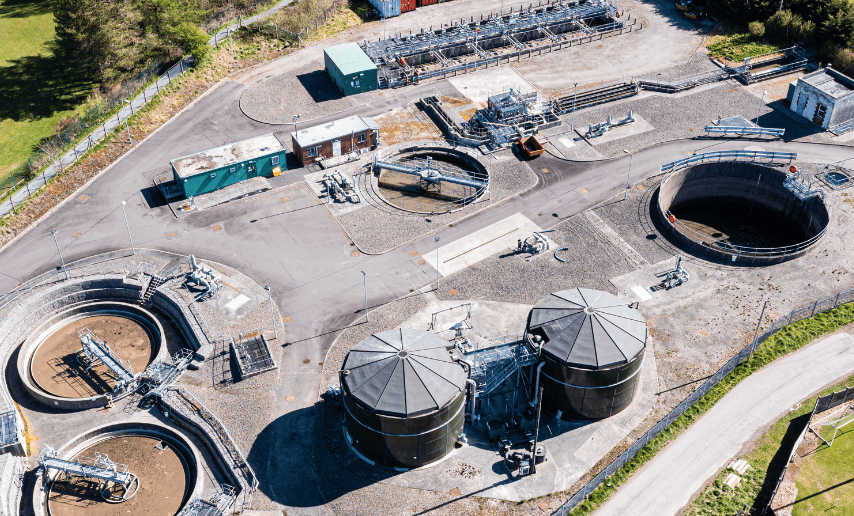

The Brush Creek Wastewater Treatment Plant (BCWTP) is located about half an hour north of Pittsburgh, Pennsylvania in Cranberry Township. The plant uses physical, chemical, biological, and membrane filtration processes to treat an average of 3.4 million gallons of wastewater daily.
The wastewater that is collected from homes, businesses, and industries, is treated and the effluent is discharged into nearby Brush Creek and is also used in the spring and summer months to irrigate Cranberry’s Highland Golf Course. It takes a team of 11 people to run the plant to ensure that the effluent is in compliance with the state’s health and safety standards.
Siloed Data, Tedious Reporting & Human Error
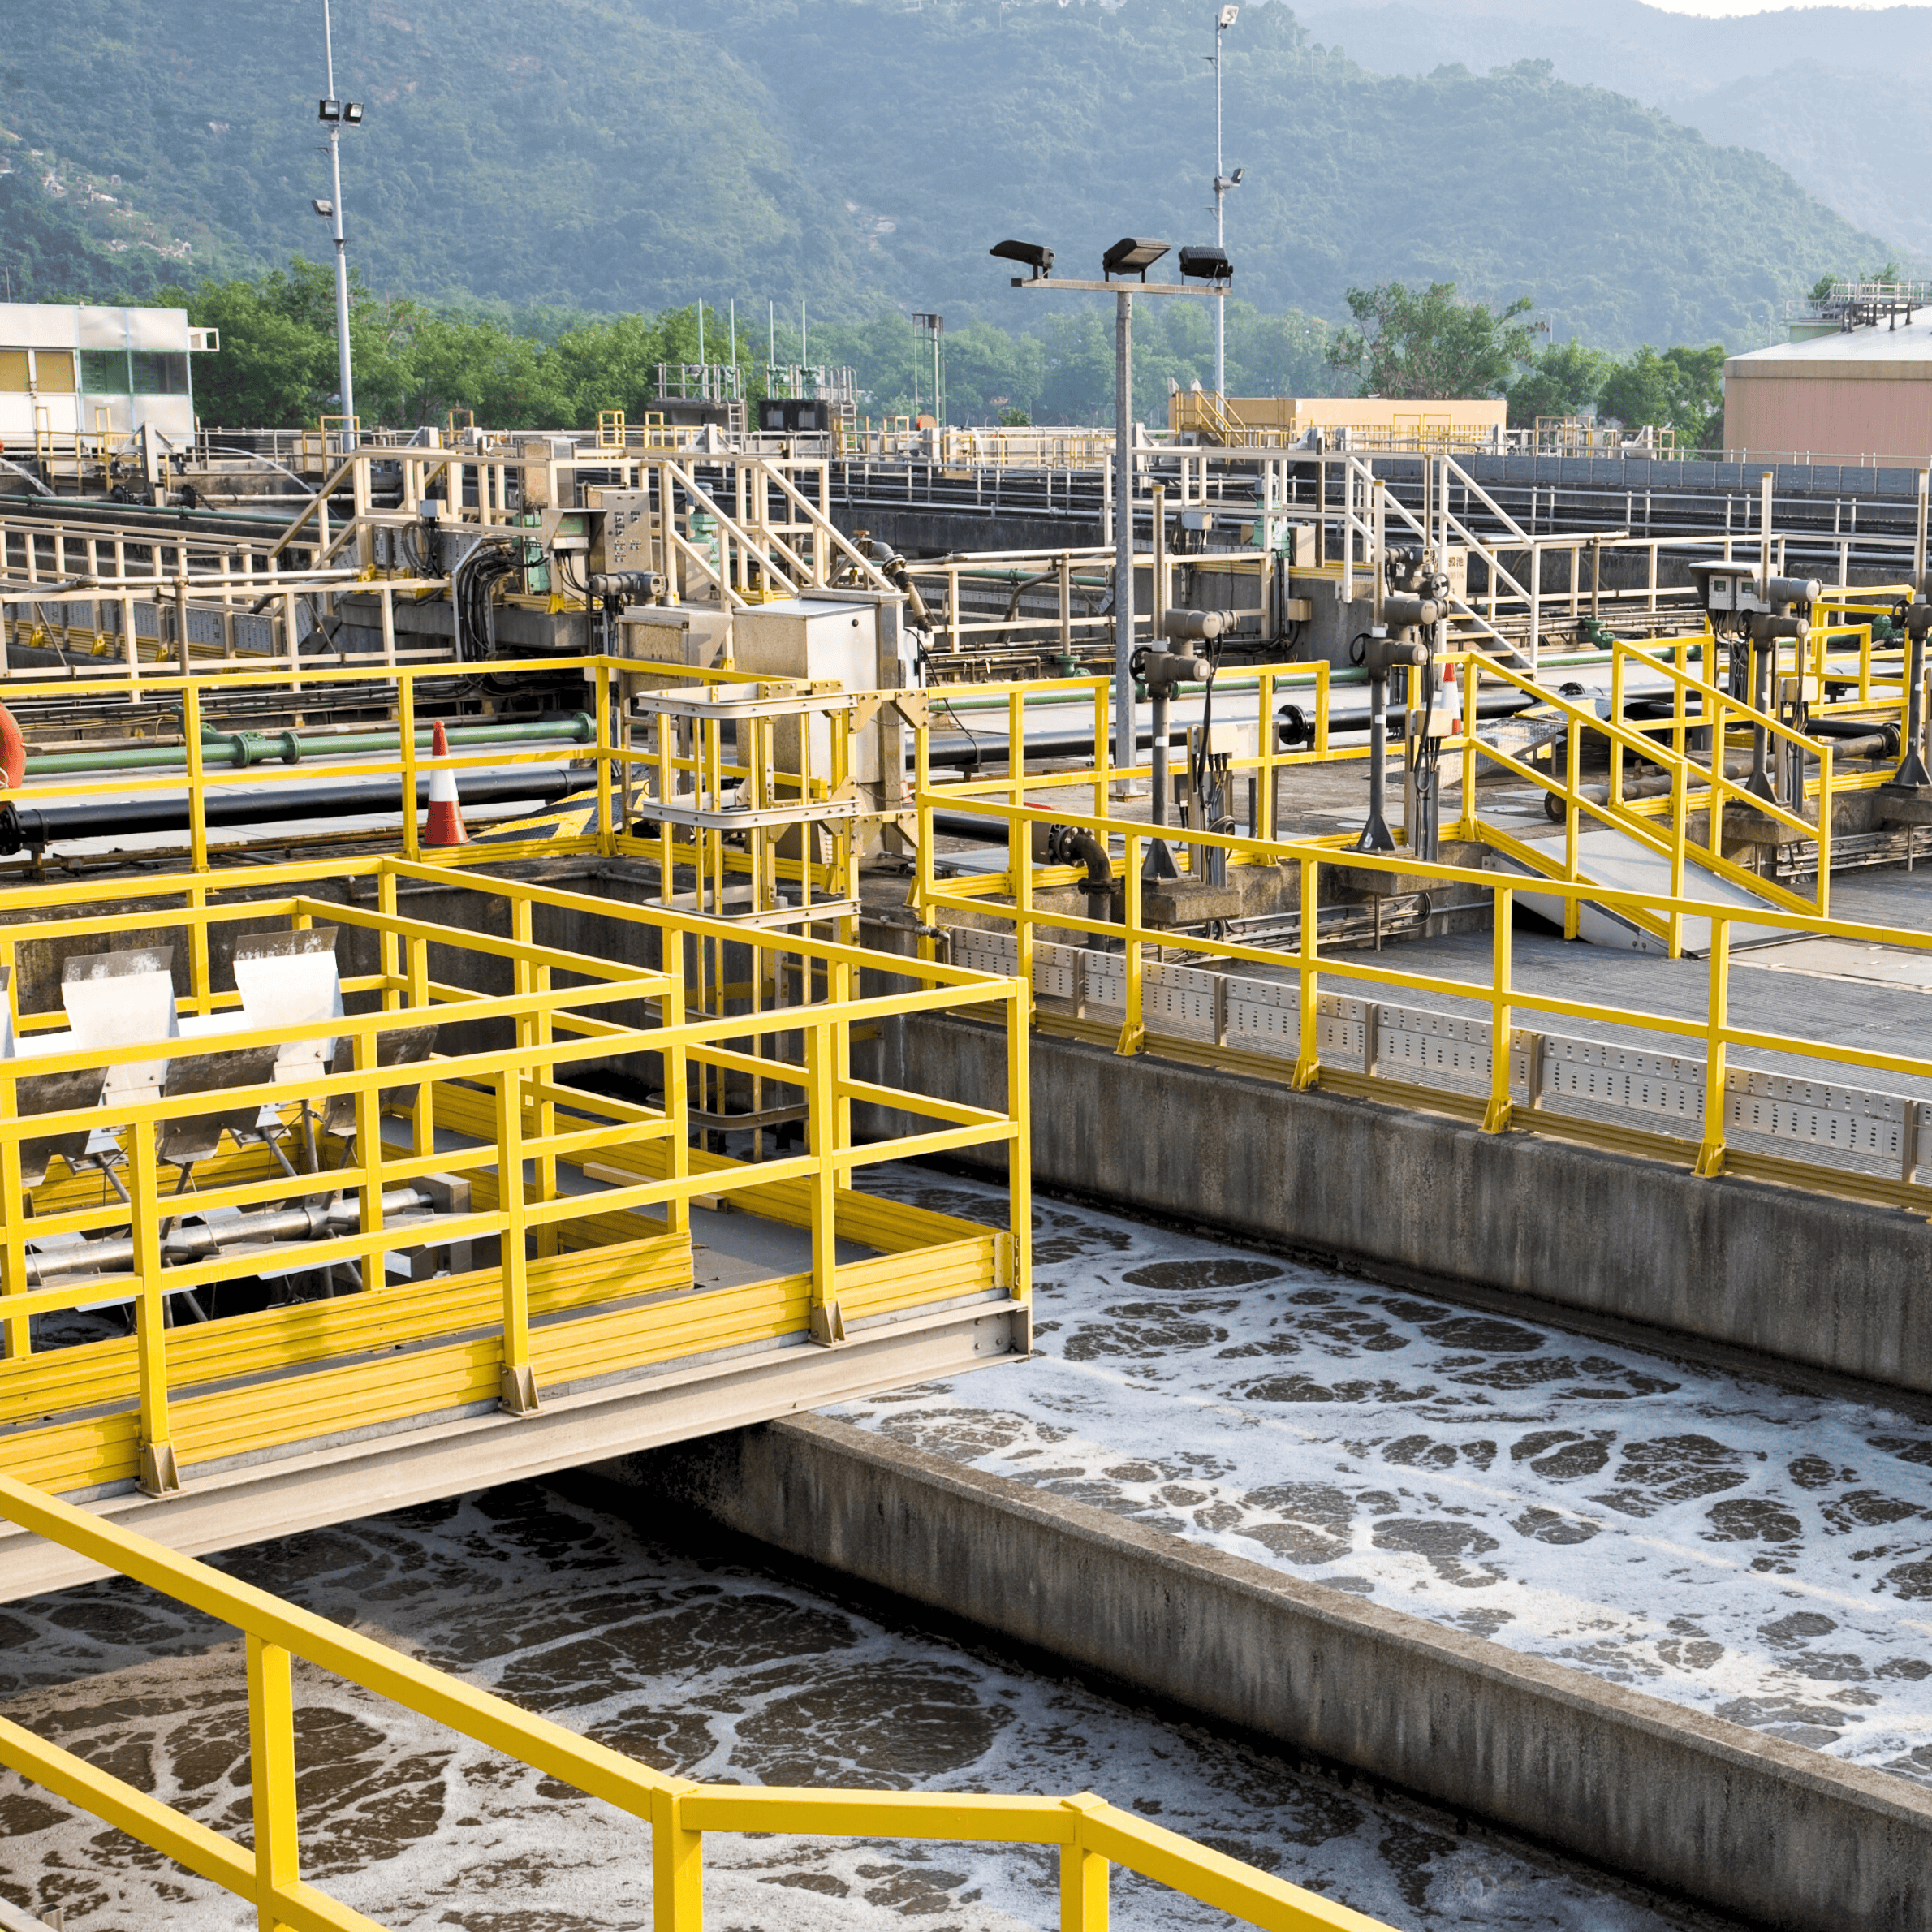
The treatment process can take anywhere from 8-10 hours to remove harmful organic substances, bacteria, and other pollutants from the influent stream and discharge clean effluent. The influent moves through multiple processes and the water quality is monitored regularly for pH, Dissolved Oxygen, Total Suspended Solids, Carbonaceous Biochemical Oxygen Demand, Ammonia Nitrogen, Nitrites\Nitrates\Total Kjeldahl Nitrogen, Phosphorus, Fecal Coliform, and Chlorine Residual. This monitoring results in a large amount of data.
Like many wastewater treatment plants, the BCWTP historically entered and stored this data in Excel spreadsheets. The old data management process was cumbersome – to make a graph, a person had to open multiple sheets and copy and paste to generate a graph representing the requested information. BCWTP had a person who would spend a whole day every month doing data entry – it’s slow tedious work, prone to inaccuracy.
Automated Compliance
In 2012, BCWTP moved to the Water Information Management Solution (WIMS) to capture and store its data in a secure, central database and provide reporting, analysis, and monitoring. BCWTP went one step further in 2018 by incorporating Rio Mobile, the mobile field data app that integrates with WIMS. The app enables operators to enter data through a mobile device.
Operators use these devices when completing daily rounds of the treatment facility and lift stations. The data is stored in the device and downloaded to an interface that automatically updates WIMS. The Plants SCADA historical database is also linked to WIMS, this makes collecting and comparing plant operation data and lab analytical data seamless.
Optimized Operations with Trend Analysis
Having the ability to organize data and choose variables or locations or time series, and display the information on one sheet, side-by-side, makes it much easier to compare variable relationships. By having a full picture, the plant manager and plant operators are able to get a better sense of the entire system when there is an abnormality, troubleshoot the cause, and determine what action needs to be taken.
An operator can pick any number of variables and WIMS will run linear regressions on the data and identify which ones are related to each other. This really helps with problem-solving. For example, every time the phosphate goes up, the ferric chloride goes down. Based on this relationship the operator can decide how to use the chemicals or what’s likely to happen when a change is made. Identifying and resolving issues before they become a problem can mean the difference between preventative maintenance and operational slowdown due to equipment breakdowns. As operators enter data into the system, it prompts action when anomalies are detected.

Flexible Customization
While there are similarities in all wastewater treatment plants there are also unique circumstances that should also be reflected in how a plant manages its data. The program is designed to be flexible and allow managers to easily customize. For instance, variables can be named whatever the user decides and can be changed at any time without losing all the data connected to that variable. Limits can be set to meet permit requirements, even if they’re seasonal, and alerts can be automatically generated. Color coding can be used to quickly visualize limits when data is entered.
Data can be organized by groups, for example, laboratory results, or SCADA or operator variables. It can also be organized by location, whether it be the membrane building or headworks, the north tank, the south tank, etc. Groups make it easy to find what staff are looking for and organize reports.
Centralizing Water Data
Every user has their own profile and permissions can be set for read-only or data entry. To keep the system organized, restrictions can be put in place so people can’t change the sheet layout or create their own sheet styles. Personalized dashboards can be created to provide individuals with a quick visual of what’s important to their roles and responsibilities. Managers can see all the lab data entry forms on their dashboard, but the operators see the front rounds, back rounds, and outside rounds, so they know exactly what they need to do when they open their dashboard.
BCWTP has over a decade of data archived in the system. Being in one centralized secure system means that data is accessible to all stakeholders. Lab data is securely imported into the system and formatted according to BCWTP’s system. The Plant Manager also has external links with state regulations pinned to his dashboard giving them access to all the information needed in one place with room to grow.