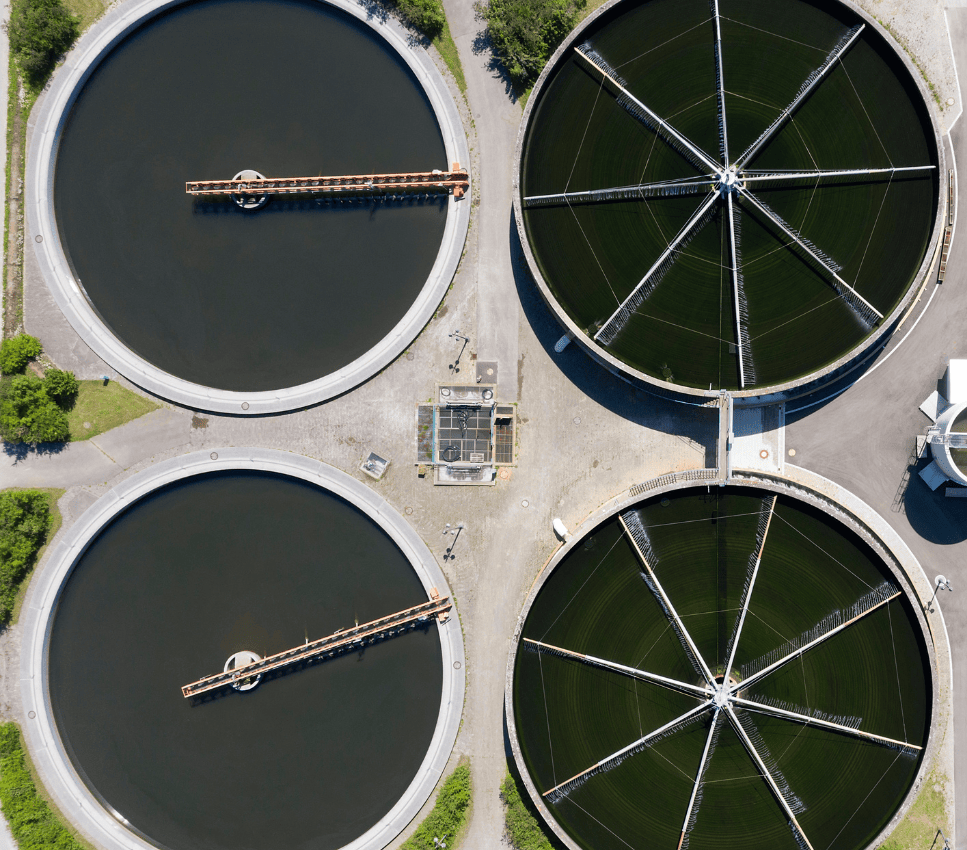
As weather severity increases around the globe, heavy, and more regular rainfall events are giving rise to greater and more sudden volumes of runoff leading to overwhelmed sewage networks and increased instances of spillage into streams and rivers. UK regulators are stepping up compliance requirements for such effluent spillages resulting in more water companies requiring, and improving, flow monitoring programs to gain a better understanding of how their assets are performing.
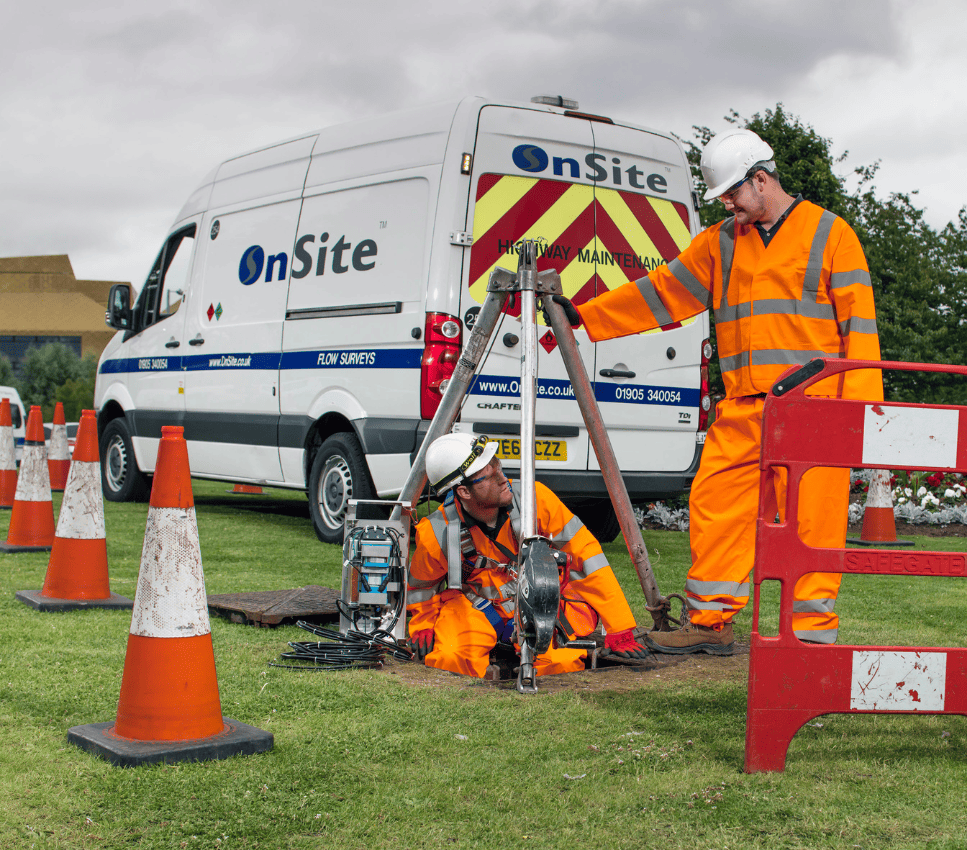
To keep wastewater flowing through these pipelines, whilst maintaining environmental compliance, OnSite Central provides specialist flow monitoring services. This includes the installation of loggers and sensors to gather large amounts of field data combined with in-depth analysis to provide water companies with valuable operational insights when and where they need it most.”
Jack Tingle, Data Analyst for OnSite Central, said “In the last couple of years, within the UK utilities sector, we have noticed a shift in demand from short-term flow surveys to permanent level monitoring. With data loggers now being more affordable and available alongside stricter regulatory demands, water companies are installing their own devices at a scale never seen before in the UK. These devices bring large amounts of data into SCADA systems, but customers are having difficulty processing this data to deliver valuable insights.”
Flow monitoring equipment measures the depth of flow and velocity in pipelines, which, when combined with metadata such as rain gauge information, can be used by hydraulic modeling engineers to assess the hydraulic performance characteristics of a particular pipeline. Good, reliable data enables asset owners to be more proactive when alerted by unusual flows, for example, implementing timely targeted mitigation measures due to a more accurate and informed prediction of outcomes.
OnSite transfers data into Aquarius from a combination of customer SCADA systems, and logger manufacturer platforms. The Aquarius software can process these large amounts of data efficiently, perform QA/QC, and using complex algorithms, provide meaningful information in a visually easy-to-understand format.
We like to try new things and push the boundaries of analytics. Aquarius keeps our data safe and on track.
Drive for Automation
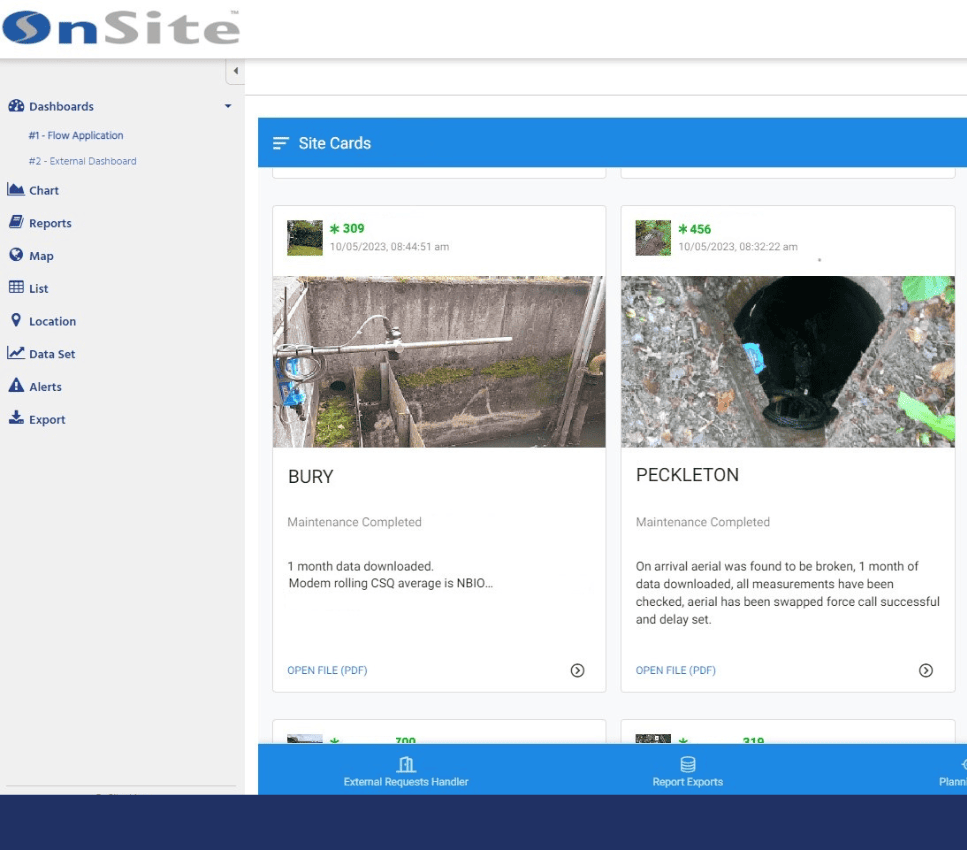
Where possible Akhtar’s team automates functionality, for example, if a data feed coming in from a site looks poor, a reporting tool in Time-Series will identify that something doesn’t look right. By checking a few boxes, it generates a schedule for the crew with a snapshot graph and instructions. Some of the instructions are automatic, for instance, if a sensor loses connectivity, it automatically polls Time-Series and pushes those results to the team. This kind of automation enables OnSite to maintain a relatively small team, producing big results. Anytime Akhtar’s team can avoid manual data entry, they do, as it removes the possibility for human error and frees up personnel to spend more time on performing analysis that can lead to action and planning.
“For a person to manually set up 100 newly installed loggers in a software program is tedious and requires a lot of time,” said Tingle. “We want our people to spend time looking at the data, not doing administrative tasks. As we are already collecting the information digitally by our survey teams, we have developed a process to transfer that existing data into Aquarius. By using the program’s API we are able to provide the platform with data we have already collected. With one click, in a few seconds, we can get all the site data populated in Time-Series – it’s ready to go.”
The new program gives us a lot more confidence in our data reports, which is not easy in wastewater applications in an uncontrollable environment – there’s a lot going on down there. Better data leads to better decision making.”
Modeling Masses of Data Over Time
By monitoring flow over longer periods, OnSite now has a history in Aquarius for events such as dry or wet periods and can average out what optimal flow rates to expect if values drop outside of those ranges, and can set an alert to flag a potential issue. Historic data amplifies the value of today’s data both for prediction and identification of probable causes for unusual or poor data.
Modeling needs from short-term surveys that may require around 500 loggers, is not much different from long-term monitoring that can have tens of thousands of loggers, but managing the data requires high-speed processing, automation, organization, and storage. The new program allows the OnSite analytics team to sort and layer data sets on top of each other and choose a variety of graphing tools to provide a rich story behind the numbers.
We can now get a graphical representation of a year’s worth of data in 3-5 seconds which helps with quick analysis. Then using the web portal, we can share this data so it’s easy for customers to see and understand.
Streamlining Data Accessibility
OnSite is in the early stages of using WebPortal which enables stakeholders to access their data online from any connected device. Tingle’s team manages how this data gets used and by whom. Information can be displayed on custom dashboards or maps, show alerts and provide live reports, empowering stakeholders with useful timely information for decision-making.
As the wastewater industry and technology continue to evolve, cloud solutions can keep up with the changes in the background and alleviates OnSite from having to maintain their own servers and software updates. With the increased emphasis on monitoring of spillage into the environment, having access to reliable data will help keep wastewater flowing and identify solutions for increasing capacity to ensure effluent makes it to treatment plants first.
