
About Miami Conservancy District
Miami Conservancy District (MCD) was created in response to the devastating floods of 1913 when the Great Miami River burst its banks, killing 360 people and devastating the Dayton region of Ohio. Under the engineering direction of Arthur Morgan, MCD built a comprehensive flood protection system that was completed in 1922. The system still protects the communities along the Great Miami River and includes five dams, retarding basins, and 55 miles of levees.
While flood protection is at the heart of the MCD mission, over the years their mandate has expanded to monitor and protect water resources and promote the enjoyment of the waterways through sustainable recreation.
Hydrogeologist Mike Ekberg joined MCD in 2000 as Manager of Water Resources Monitoring & Analysis. He has seen the evolution of data collection and usage, starting with entering raw data into spreadsheets, and then using various new software programs of the time, and in MCD’s case, eventually hiring an IT person in the mid-2000s to manage a SQL database and create custom applications.
We tried a few different approaches, but never quite felt we were where we wanted to be. Quality assurance and accessibility were always an issue. When we had requests for information, we gave raw data which meant the requestor was doing their own analysis, or if we created graphs of the data from excel, it was only a snapshot of that one parameter.
Fortunately for MCD, Ekberg had been with the organization for over two decades, which meant he carried the knowledge of what data existed and where it could likely be found. This was not the case for IT personnel. Every time the IT person moved on, a new person needed to be trained and they came with different ideas on how to do things. “We ended up with a hodgepodge of data tools that were not really cohesive, which ultimately became the main driver for us to search for a new paradigm.”
The bottom line was that MCD wanted to focus on the science and health of the watershed, rather than manage technology. Ekberg spoke with neighboring agencies in search of a different approach, many of which were using Aquarius software designed by Aquatic Informatics to acquire, process, model and publish water information in real time.
The web portal was a really important feature for us, as it would improve data accessibility and relieve us from IT overhead. We liked the results our colleagues were having with Aquarius, and so we made the switch.
Accessibility through Web Portal
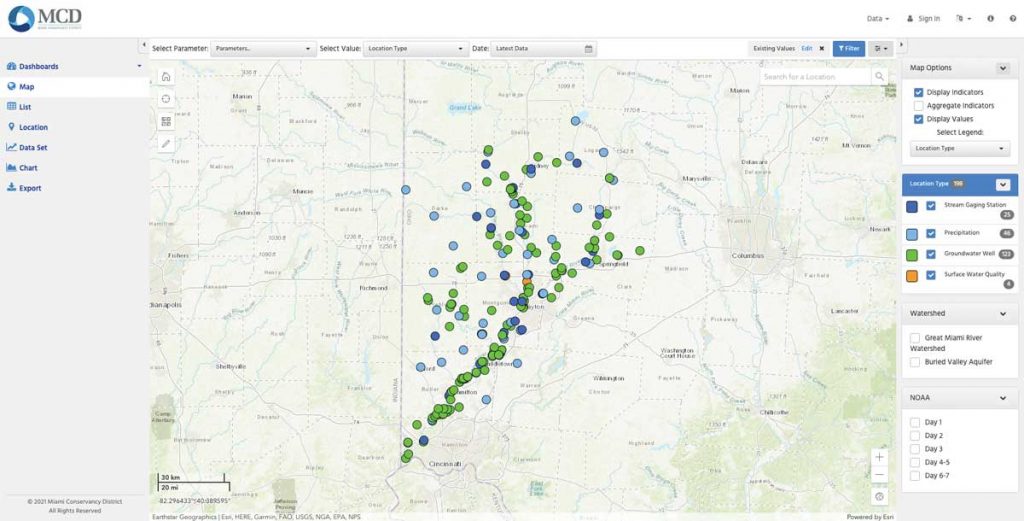
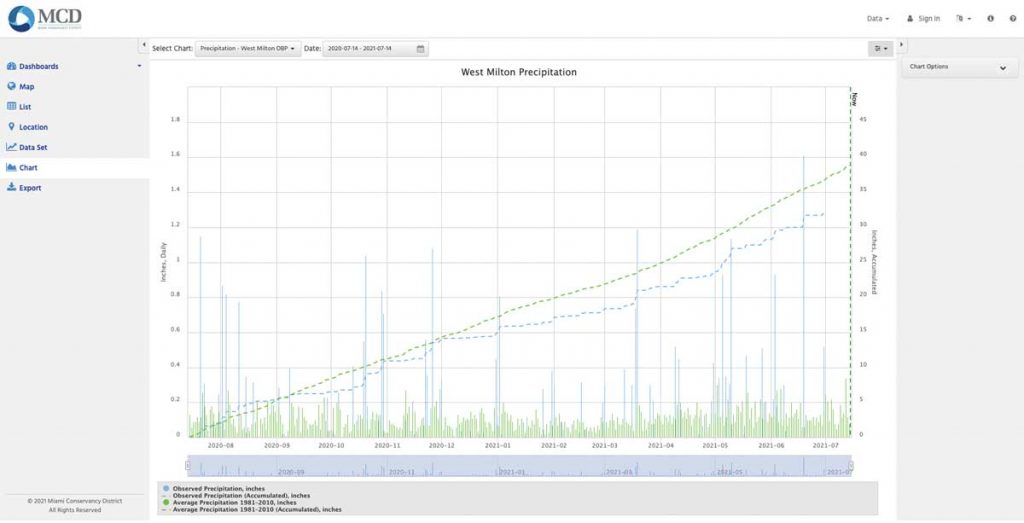
The MCD Water Data Portal has custom dashboards that provide a live view of environmental conditions such as groundwater water levels, stream flow, air and water temperatures, rainfall statistics, or rising reservoir levels.
MCD can display information in charts, graphs, maps, meters and timelines making it easy for users to zero in on the information they are looking for. “If we have a heavy rainfall, users can set parameters on the portal to see the river level today vs. yesterday.”
From an IT perspective, Aquarius is hosted in a secure private cloud that alleviates MCD from having to maintain their own servers and software updates, while providing the latest in data security. As industry and technology continue to evolve, cloud solutions can keep up with the changes in the background, ensuring users always have the optimal tools.
Aquarius has made managing our data much more efficient. . . We can easily access and track the data to look for long term patterns and make predictions based on past trends.
One Accurate Data Source
Engineering staff are now able to go into Aquarius and source the information they need and use modeling tools to know when is the best time to repair a flood gate, or how much of a low water level window they will likely have in order to repair a concrete dam wall and so on. The software automatically centralizes vast amounts of hydrologic time series data, discrete measurement data, and complex river gauging measurements from various locations. It also routinely performs data quality checks using error detection, data cleaning and flagging tools with automatic bias corrections.
“These automated tools give us confidence in the quality of our data, which allows us to have greater certainty with our assumptions of the future and how we can best serve and protect the people of the Miami River watershed,” said Ekberg. MCD also has integrated data feeds directly from USGS, NWS, and other monitoring agencies giving them the ability to show a bigger picture and reciprocate with sharing their own data for greater collaborative watershed management.
These automated tools give us confidence in the quality of our data, which allows us to have greater certainty with our assumptions of the future and how we can best serve and protect the people of the Miami River watershed.
Streamlining Data Accessibility
An increasingly important role for MCD is community outreach to encourage residents to responsibly enjoy the amazing recreational opportunities that the Great Miami River brings to southwest Ohio.
MCD engages with the public through their blog as well as interviews on TV and radio, and they do quite a few presentations at schools and community events. “The convenience of going online from anywhere and accessing our data to answer questions or demonstrate the current state of the watershed is very powerful when we are doing a presentation, especially when we can use visual displays to get our point across to the general public,” said Ekberg.
With better access, capabilities and insight into MCD data, the people of southwestern Ohio will continue the legacy of flood protection that was designed by Arthur Morgan back in 1918 while enjoying and protecting the beautiful Great Miami River.