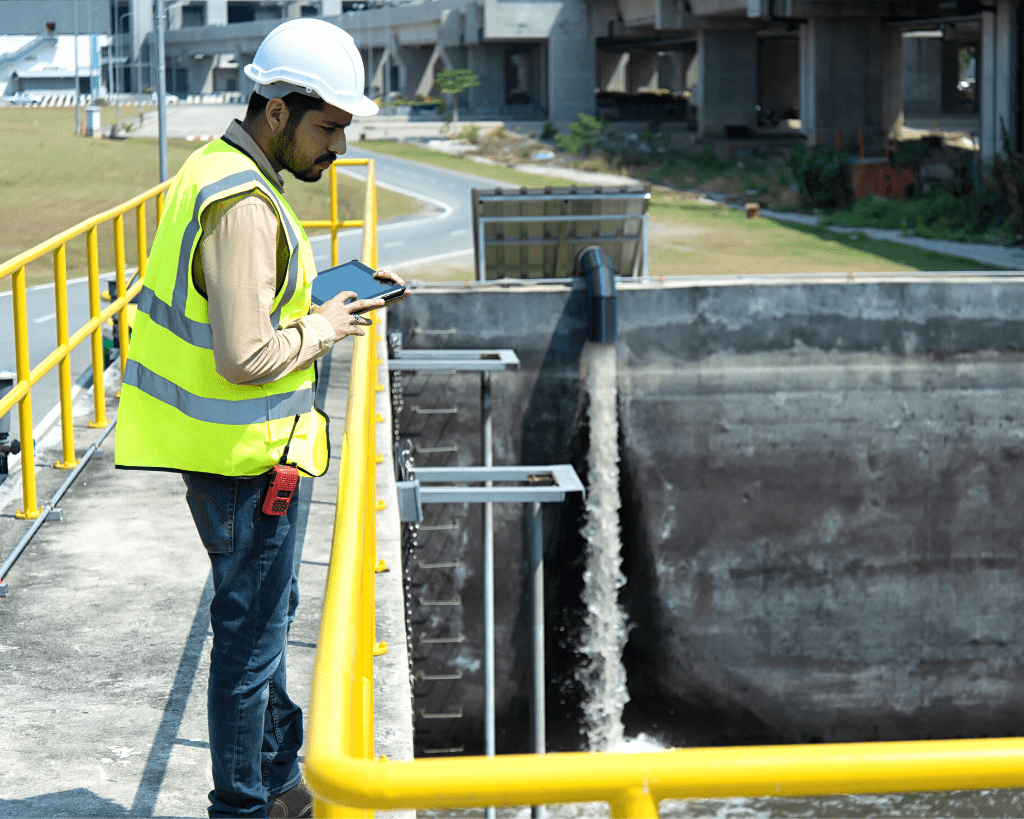
Back in 2012, the City Of Columbia made the decision to update its OPS SQL software to Hach WIMS (water information management system). The old software was not only sitting idle, but was also out of date. The reasons for updating and implementing the software were many but can be summarized with the two primary goals: To collect the data into a central database that is easily accessible and to create a dashboard from which the rotating operations teams or management could quickly understand what was happening. Madeline Zimmerman, a senior staff Assistant with operating experience, and David Wiman, the operations supervisor, were the city champions for this endeavor.
“Our situation with data was a bit chaotic,” Hickman says. “There was data everywhere. We were using Excel, but Excel is Excel. We needed some type of solution to store and organize that data to help us make better and more timely operations’ decisions.” Wiman added, “The operators needed to understand how the treatment-process data was trending when they arrived at work. Understanding this helped them to learn the operational big-picture objectives and how decisions made in one treatment process could directly affect other treatment processes.”

WIMS Provides a big win
That answer came in the form of Hach WIMS, a real-time digital system that seamlessly integrates the collection, aggregation, and tracking of data, while also generating customized reports and presenting information and insights in easy-to-access customizable dashboards. There are more than 1,500 WIMS systems operating throughout North America. The solution has proven to be highly scalable and affordable, making it a viable option for remote groundwater installations on up to the largest municipalities in the nation.
“The day we started using WIMS during shift change, everyone put down their phones and really got into the information on the screen,” Hickman recalls. “They started asking questions and making suggestions. It was much more engaging. I thought that initial curiosity might wear off, but it hasn’t. Those meetings are so valuable now, and everyone is focused on improving our performance because they can see how they can make an impact.”
WIMS has proven to be a great tool for improving operations. Now with a few clicks, we can get the information we need to make decisions and make sure everything is running smoothly.

Data trends offer insights into operations
Particularly valuable has been the ability to clearly show data trends over varying time periods. By getting a holistic view of the data and trends, the team can more easily identify where there might be a challenge or an issue that is emerging that needs to be addressed.
The WIMS system also allows for the creation of color-coded KPIs (key performance indicators). For instance, if a reading is within the normal range, it is signified by blue, while yellow provides a warning, and red indicates a problem. For certain parameters, the yellow and red readings automatically generate trigger reports that alert staff of a potential issue. The trend data also serves to keep employees up to speed on what is happening in the plant at any given time.
“Seeing the data in a trend makes it easier to quickly see what is going on. Previously,” Wiman recalled, “I would get calls at home from panicked operators asking what to do based on a single data point. I would ask them whether that data was trending up or down, and they didn’t know.”

More efficient chemical use
In Columbia, they are just beginning to identify the many benefits of the WIMS system beyond improving communication, collaboration, and bolstering employee engagement. WIMS is allowing for more efficient use of chemicals by clearly identifying trends and showing a more holistic view of overall plant operations through various data points that are presented on the dashboards.
In early 2014, the city installed online instruments that were tied to their SCADA (supervisory control and data acquisition) system, which provided reliable real-time data. Now the steady monitoring allows for more targeted use of chemicals, which improves efficiency and will lead to cost savings.
We are feeding a lot less bleach and use a lot less sodium bisulfite for dechlorination. Because the operators monitor the trends impacted by the chemical usage every day, chemical use in general has become much more efficient and effective.

Customized dashboards and on-demand reporting
Another key benefit has been the capability for customized dashboards offered by the WIMS system. That allows different users from throughout the plant to create dashboards that include only the information that is relevant for them. WIMS can also automatically generate and email on-demand customized reports that show data trends and selected information. For instance, solid-retention time reports are sent on a regular basis to plant engineers.
“Everyone can have their own dashboard and their own scheduled reports sent at specified intervals,” Hickman says. “I want to see how the lab is performing for quality control, while our director has a dashboard that provides high-level data such as daily flows for the last 12 months.”The facility aims to continue building on the capabilities offered by WIMS to improve productivity, performance, and operate the plant in the most cost-effective ways possible.

