About Herrera
Established in 1980, Herrera Environmental Consultants, Inc. is an innovative employee-owned consulting firm focused on three practice areas: water, restoration, and sustainable development. Herrera’s interdisciplinary teams of scientists, engineers, and planners provide scientifically defensible and realistic solutions to complex resource challenges facing municipalities, utilities, government agencies, Tribes, non-profits, and businesses. Herrera’s philosophy is to integrate the protection of environmental, cultural, and economic values into all their projects.
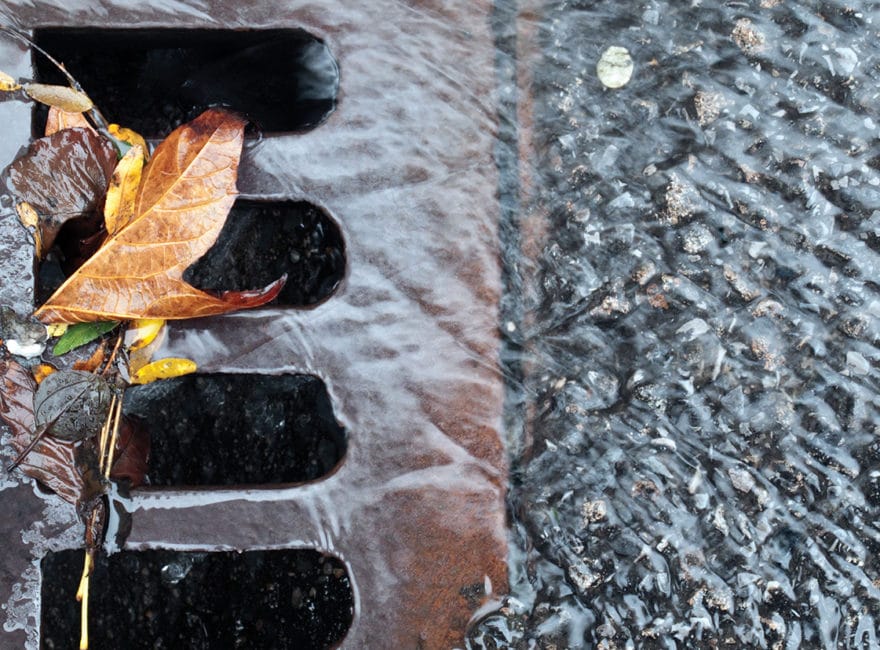
“At Herrera, we are highly specialized in solving complex stormwater challenges,” said Dylan Ahearn, Associate Scientist at Herrera Environmental Consultants. “We are renowned experts in the field of green stormwater infrastructure – including green retrofits, permeable pavements, bio retention, full dispersion, and other methods – for reducing and infiltrating stormwater to minimize impact on local receiving waters.”
The Challenge: Disjointed Data of Varying Quality
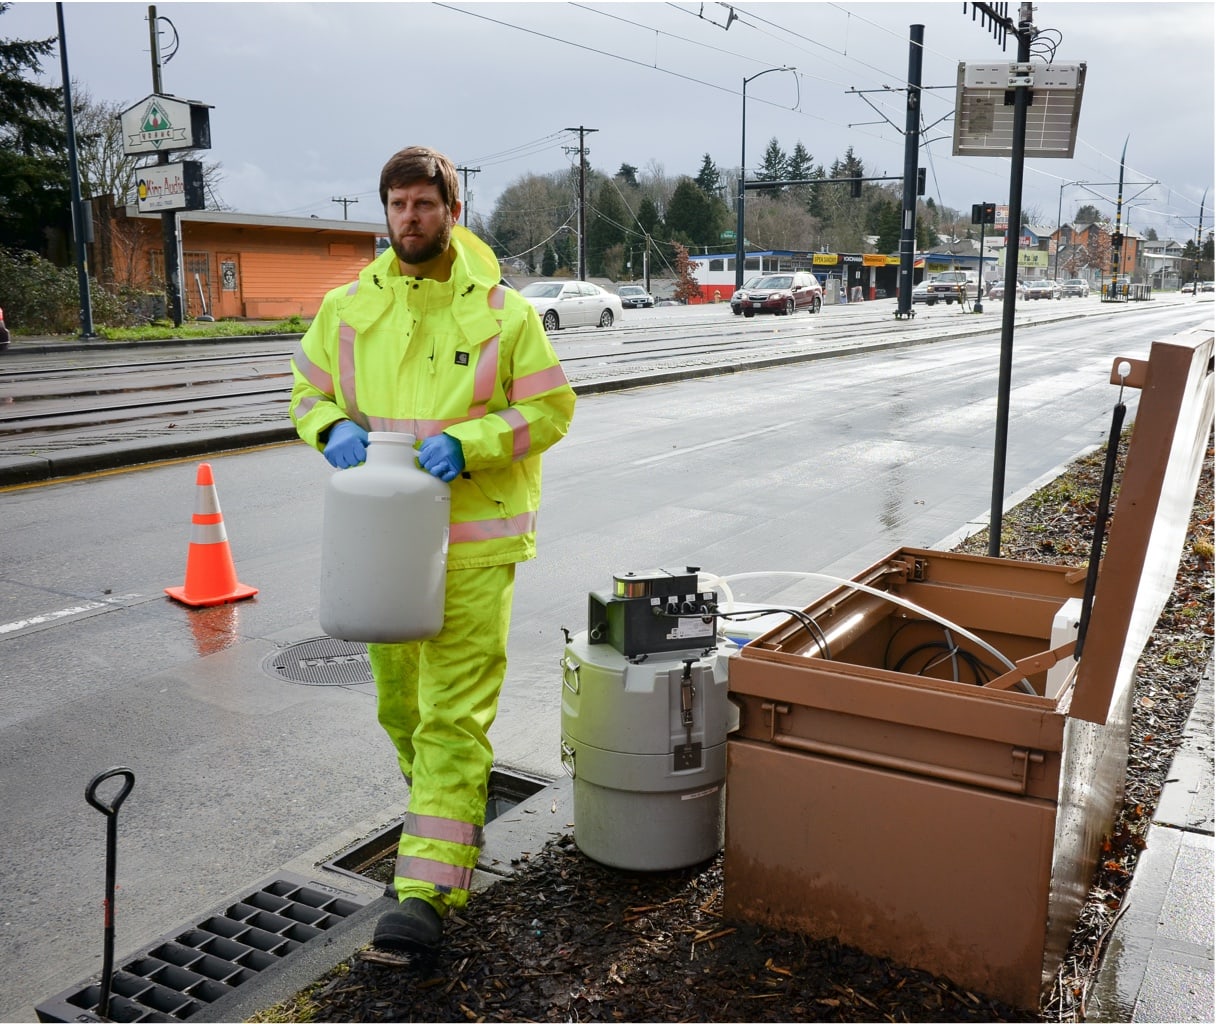
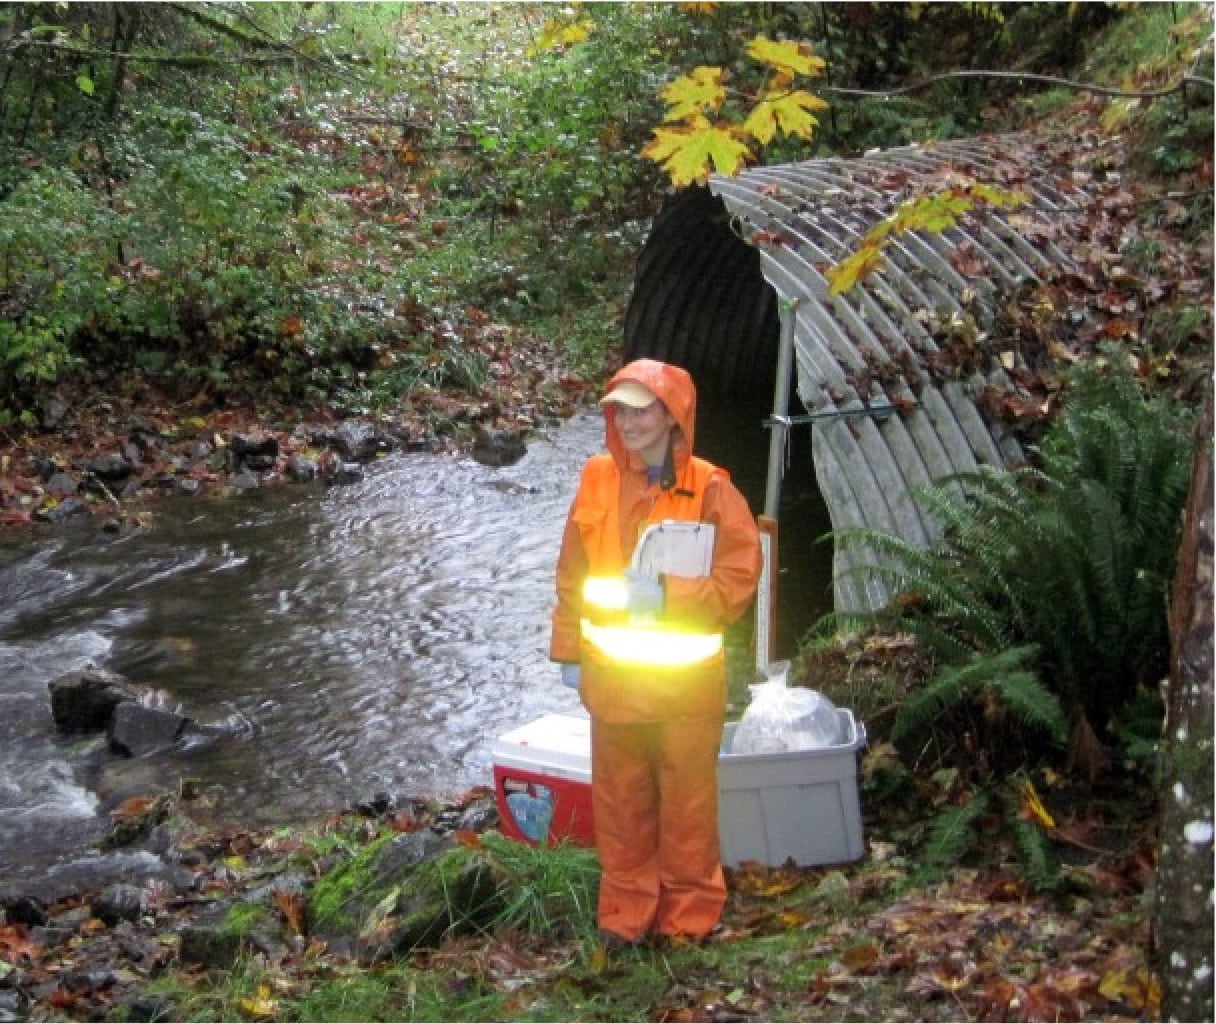
Herrera maintains and operates water monitoring networks on behalf of clients. Telemetered stations log environmental data on regular 5 minute intervals. A variety of sensors are employed, including YSI water quality sondes. The firm also collects flow data and volume weighted composite samples, which provide a reliable estimate of the mean chemistry of storms. All of this monitoring activity results in large volumes of environmental data.
Previously, data collected from automated samplers and flow meters were logged and managed using software provided by equipment manufacturers. “The interfaces were very clunky. It was not easy to visualize data and corrections were very difficult, rudimentary, or simply not possible depending on the vendor software. Data corrections were not tracked,” explained Dylan.
Herrera is frequently engaged to conduct Best Management Practices (BMP) assessments in addition to research and development (R&D) on stormwater filters. This monitoring and research requires multiple autosamplers connected to dataloggers located at each location to monitor the inlets and outlets of the stormwater filters. “When Herrera consolidated to Campbell data loggers, we struggled with visualizing the data and there was no way to correct data,” continued Dylan. “Excel made it terribly time consuming to manage text files from loggers. Using proprietary equipment vendor software resulted in disjointed and dispersed data sets. Deploying five different sensors for every client project meant using five different programs, each platform with its limitations in terms of functionality for visualizing, exporting, and correcting data. We wanted to move towards using one central platform to effectively store, correct, and visualize all the data we collect.”
In addition to seeking efficiencies by centralizing data management, Herrera consultants also sought to produce the highest quality hydrometric data for clients. “Professional laboratories have strict QA standards, which are backed by standard methods and verified by regular audits from state regulators. However, the same standards are rarely applied to the collection of flow data within our industry. This results in a situation where quantity and quality datasets have disparate QA, and pollutant loading estimations suffer from a high degree of uncertainty,” explained Dylan. “As consultants who are relied upon to produce highly accurate assessments of pollutant export and capture for our clients, this situation was simply unacceptable.”
The Solution: Aquarius
In 2010, Herrera selected Aquarius Time-Series as its modern water data management and analysis platform. “We chose Aquarius Time-Series because its user interface is very intuitive and streamlined. It provides a very easy and simple way to manage our data,” shared Dylan. “We’ve been very impressed with both the Data Correction and the Rating Curve Development toolboxes. They have proven to be invaluable for us in terms of creating a QA log that we can then deliver to our clients.”
Centralized Data Storage, Corrections & Visualization
“Today, we can use the most suitable sensors and samplers for each project … all the data comes together using Campbell data loggers that feed directly into Aquarius Time-Series. Data from many different types of loggers are collected and centralized every 5 minutes,” continued Dylan. “Aquarius makes it easy to visualize the data to monitor network performance and hydrological events. It has given us peace of mind as we use real-time visual assessments of our telemetered data to confirm that our many gauges are functioning properly in the field.”
Previously just visualizing data was a challenge. Dylan explained, “in Excel it’s very difficult to move around to look at your hydrograph. Visual QA is something we pay close attention to – it’s very important to us. Aquarius Time-Series makes it very easy to pan through hydrographs, zoom in, zoom out, look at multiple signals on top of each other, and compare rainfall. We do it all with Aquarius.”
Herrera has been using Aquarius for a decade. It has revolutionized the way we manage and QA our data. Our clients now have the security of knowing that the same level of QA has gone into their flow and water quality data. That’s what we value the most. It gives us great pride to present the highest quality data to our clients.
A Competitive Edge with the Highest Quality Data
With its automated sampling work, Herrera collects and manages lots of chemistry data by engaging commercial labs for the sample analysis. Those results are returned with pages of rigorous QA sheets, providing assurance on the quality of the consulting work and final data. “We are collecting flow data right alongside that chemistry data. We wanted to give our clients the same level of assurance that their flow data was also of the highest quality possible. Aquarius Time-Series has made that possible,” reported Dylan.
The Aquarius Time-Series Data Correction toolbox provides Herrera consultants with an easy-to-use graphical data correction and editing environment. Multipoint drift corrections, threshold corrections, spike removals, drift adjustments, and pro-rated percent corrections are just a few of the many data correction options available to account for sensor drifts, fouling, spurious values, and incorrect sensor configuration. Aquarius Time-Series maintains a permanent record of all raw data, while the audit log automatically tracks all corrections, processing, notes, and remarks for time series data.
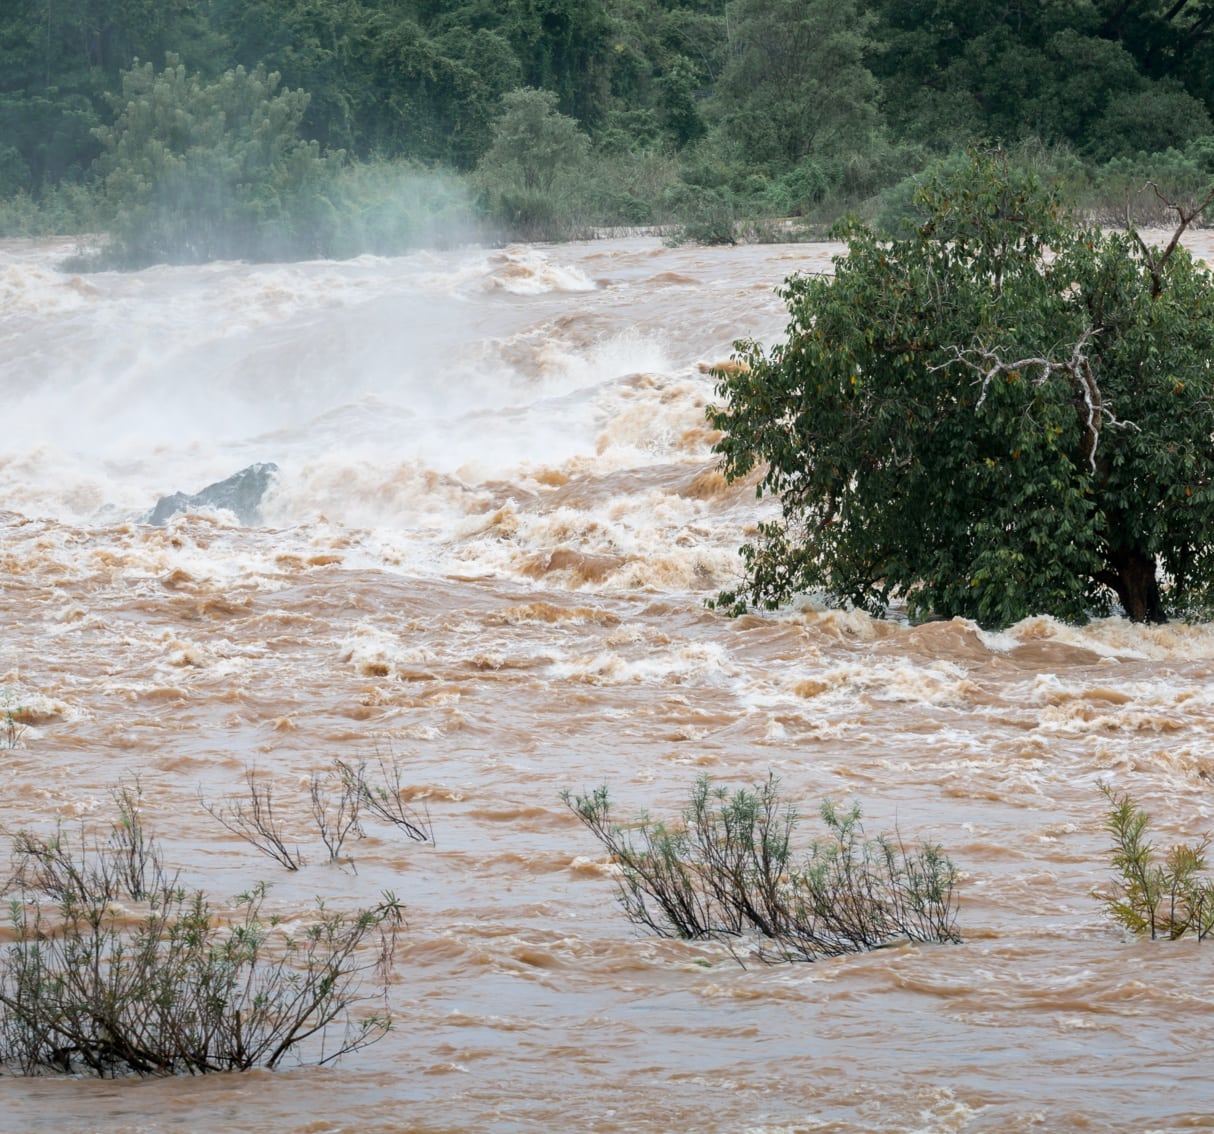
“Herrera has been using Aquarius Time-Series for almost a decade. It has revolutionized the way we manage and QA our data. Before we simply couldn’t correct gaps, spikes, and drops. Now we’re able to polish data sets and maintain an audit trail of edits made. Our client reports include the whole audit trail, the corrected data, and the original signal for each of our storm signals,” shared Dylan. “Our clients now have the security of knowing that the same level of QA has gone into their flow and water quality data. That’s what we value the most. It gives us great pride to present the highest quality data to our clients.”
“Aquarius Time-Series has given us a distinct competitive advantage,” added Dylan. “We highlight Aquarius in all of our proposals, which has really helped us win new business. Clients can see that we are truly dedicated to quality when it comes to flow data. We’re able to present results in a format that clients haven’t seen before, with a higher level of rigor in QA that’s made possible by using Aquarius tools. It has helped us differentiate Herrera and win projects. Clients have even subsequently adopted the Aquarius platform themselves.”
Aquarius Time-Series has revolutionized the way we manage and QA our water data. We now deliver flow data to our clients which has a clear audit trail, a QA history, and estimations of measurement error, all with 50% efficiency gains. This has given us a distinct advantage over the competition.

50% Efficiency Gains
With fewer surprises, Herrera consultants are better able to focus on project goals and objectives, without getting mired in issues associated with poor data quality, disjointed data sets, and complex data processing challenges. They can now deploy the best sensors for the job, without worrying about data management complications. All data is automatically ingested and centralized in Aquarius Time-Series. Herrera consultants can efficiently review data as it is ingested every 5 minutes from many different sensors, for many different client projects.
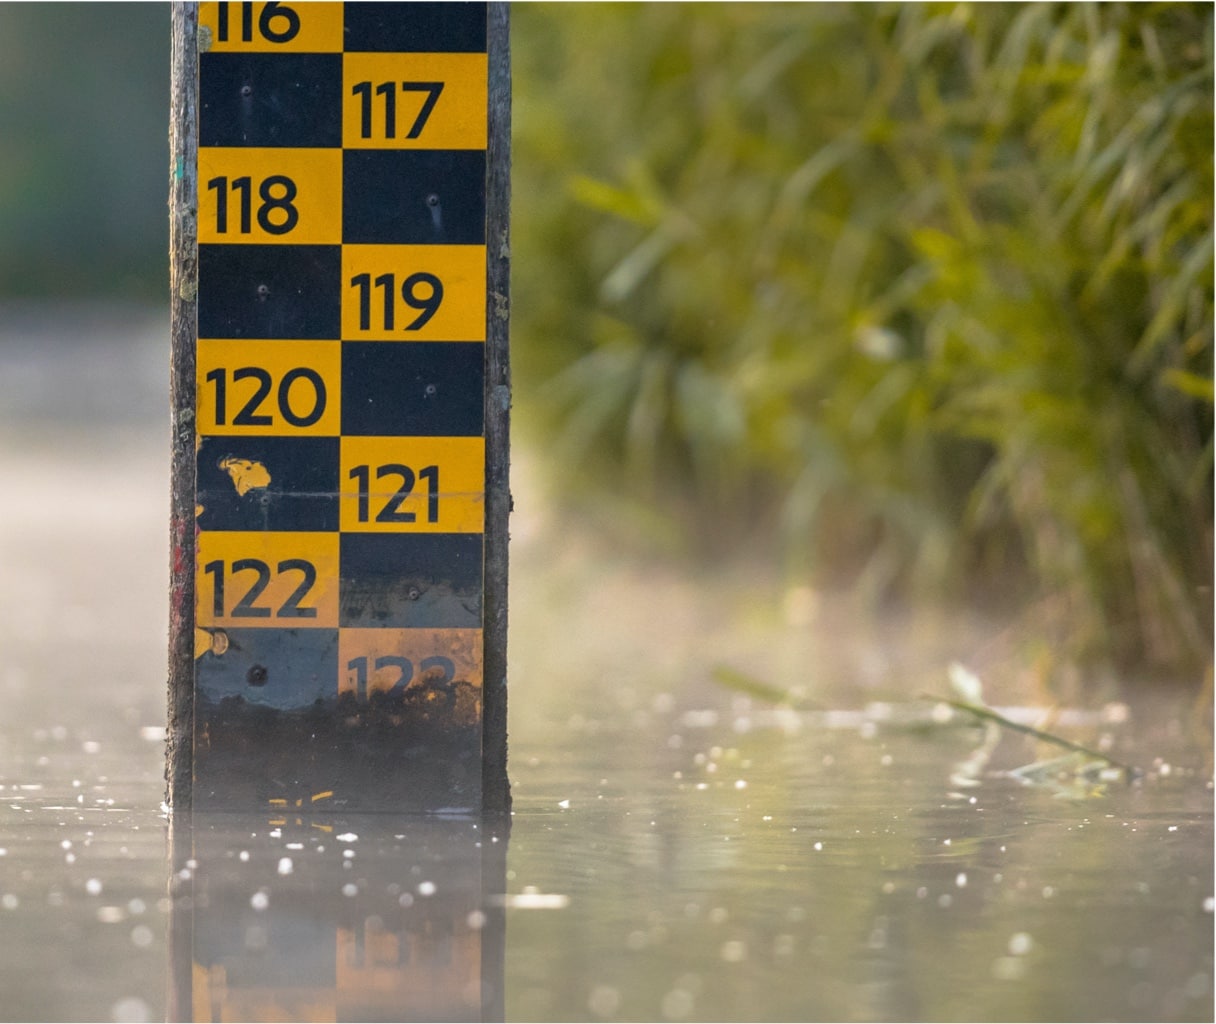
“The bulk of our work is in storm drains, but as we venture into more stream gauging we’re gaining an even deeper appreciation of the power of the Aquarius Time-Series data management system. The Rating Curve Development toolbox is an industry standard used by top agencies like the US Geological Survey and gives us the ability to assure our clients that they are receiving the best possible service.” Dylan concluded, “Aquarius Time-Series has empowered us to streamline what we do as environmental consultants. It’s been a huge time saver for sure. I would say that we have seen 50% efficiency gains.”
Solution Highlights
-
Centralize previously disjointed data sets
-
Visualize & review data in real-time
-
Improve monitoring network performance
-
Correct data, track changes & monitor quality
-
Impress clients with the highest quality data
-
Gain 50% efficiencies in data management
-
Win projects with a distinct competitive edge
