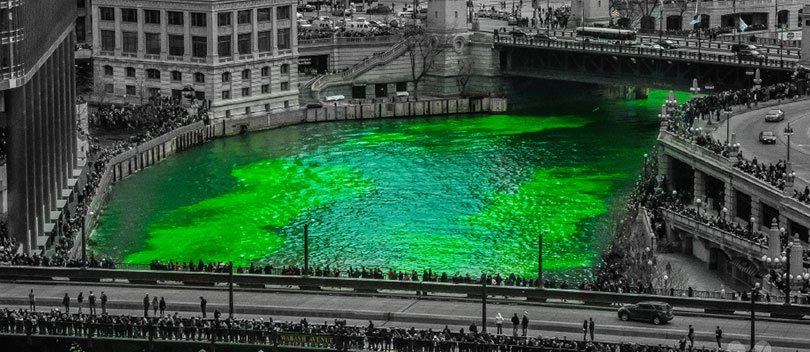
St Patrick’s Day, Hydrology & Dyeing the Chicago River Green
Everybody loves to celebrate St Partrick’s day: dressing in green; drinking green beer; and ever since 1961, dyeing the Chicago River green.
That was the year the city began enforcing water pollution controls and green dye was used as a tracer to confirm the sources of illegal discharge. The effect the fluorescent dye on the river was noticed and somebody had the idea to commemorate St Patrick’s Day by dyeing the whole river green.
They originally used 100 lbs of fluorescent dye and the river stayed green for a week!
The second year they used 50 lbs and the river stayed green for three days. Nowadays they use just 40 lbs of vegetable dye to keep the river green for several hours.
Dyes are not only used for qualitative tracing (e.g. to determine the fate of water from a source) but also for quantitative measurements.
The principle of tracer gauging (a.k.a. dilution gauging) is that if you can measure the concentration of a solution containing a known mass of dissolved, well mixed, solute then you can easily calculate the volume of the solution. For measurements of streamflow, stream water is the solution and either a fluorescent dye or salt are commonly used as the solutes. Fluorescent dyes can turn the stream bright green (e.g. Fluorescein) or bright red (e.g. Rhodamine) whereas salt changes the electrical conductivity of the water.
Dilution gauging works brilliantly in exactly the types of streams that are difficult, or impossible, to measure using conventional area-velocity methods – fast flowing turbulent water. The first step in the process is to develop a calibration for the relation between sensor measurements and concentration. A conductance probe is used for salt and a fluorometer is used for dye. In either case, it is best to calibrate the relation between the sensor value and concentration in the field with streamwater at ambient stream temperature.
Calibration involves adding a carefully measured quantity of solute to known volume of solvent and then making sensor measurements in successive iterative dilutions of the solution to get a number of calibration points. The resulting calibration curve should be linear. The real trick to a successful dilution gauging is getting a good calibration in the field. This is all the more challenging for fluorescent dye because a very small input quantity can produce a desirable level of response in a very large volume of water. This means either using laboratory precision instruments for measurement of the solute or using many iterative steps to get sufficient dilution of the calibration solution. Either approach can be problematic in the field.
Salt is widely preferred because it is cheap, reliable and relatively forgiving to calibrate. The use of fluorescent dye is advantageous whenever the volume of discharge would require a massive amount of salt to generate a response curve or when the solute needs to be backpacked a long distance (e.g. to a remote mountain stream). Fluorometer measurements are sensitive to ambient light, turbidity and aeration in the water. Great care has to be taken to control for these conditions during the calibration and measurement. It might be preferable to do dye measurements at night - both to control for ambient light and to avoid alarming bystanders with the abrupt change in stream color – but not many agencies consider working next to remote, fast flowing, turbulent streams in the dark to be a safe work practice.
In either case the measurement itself is relatively straight forward. The slug injection method involves placing a sensor in a downstream location where complete mixing is assured and then dumping a known quantity of solute in an upstream location. The sensor is monitored while the solute passes by the monitoring point and the measurement is finished when the conductivity (salt) or fluorescence (dye) returns to background state. The area under this breakthrough wave and above background is integrated, converted to concentration using the constant determined by calibration and then divided by the mass of the injected solute to produce a volume.
An alternate method is constant rate injection which requires a pump or other device to meter a fixed known rate of a solution of known concentration into the stream. The volume of flow can be determined proportionally. The relative difference in concentration between the injection solution and the well-mixed streamwater can be applied to the pre-determined injection flow rate to determine streamflow discharge. The constant rate injection method can be time consuming to set up properly but can be very effective especially for very small streams.
A key assumption of any dilution gauging measurement is that there is complete mixing.
It is advantageous to use two or more sensors located in different locations. If mixing is complete the computed discharge from all sensors should be in close agreement otherwise a different mixing reach should be chosen. One advantage of dye over salt is that the mixing process can be observed qualitatively. It is always very interesting to watch how flow lines set up and decay in natural streams.
Almost everyone who has ever done fluorescent dye tracer measurements has an entertaining story to tell.
Some of these stories have entered the realm of hydrometric mythology. One of my favorites is of some engineers who had just finished a research project near Halifax Nova Scotia but had a leftover bucket full of Rhodamine dye concentrate. They wanted to dispose of the dye and one of them thought it would be best to flush it down the toilet. What they didn’t know is that Halifax did not have sewage treatment at the time (this was in the 1960’s) and that sewage was discharged deep under the Halifax Harbour. According to the story, they inadvertently turned Halifax Harbour red!
If you have any interesting tracer measurement stories you would be willing to share, please comment on this post.
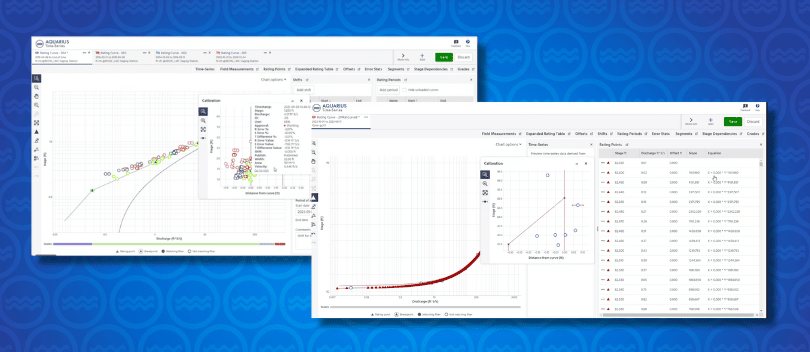
Free Whitepaper: 5 Best Practices for Building Better Stage-Discharge Rating Curves
A reliable rating curve is one that is credible, defensible, and minimizes re-work. This paper outlines 5 modern best practices used by highly effective hydrographers.